
What if your knowledge graph’s most damaging quality failure isn’t a wrong record, but a relationship that looks plausible and sends a decision in the wrong direction? Knowledge graph data quality can’t be judged by counting complete, valid entities alone. A graph is reliable only when its connections, context, and supporting evidence hold up for the decisions it informs.
Traditional quality dashboards often measure records while overlooking broken links, mistaken entity matches, stale relationships, or missing provenance. Teams also need shared definitions, thresholds, and ownership. Without them, quality scores rarely translate into consistent action. For analytics and AI, those gaps can undermine retrieval and reasoning even when individual records appear sound.
This guide offers a practical framework for measuring quality across entities, relationships, and provenance. You’ll learn how to define dimensions such as accuracy, completeness, consistency, and timeliness; create repeatable validation tests; and monitor results through clear governance. The goal isn’t a one-time cleansing exercise. It’s an ongoing Context Engineering discipline that helps enterprise teams assess whether graph data is dependable enough to support trusted intelligence and explainable AI.
Key Takeaways
- Measure quality across entities, relationships, and provenance so checks reflect how the graph will be used.
- Build a knowledge graph data quality scorecard around distinct dimensions, and avoid letting a single composite score hide critical weaknesses.
- Establish a repeatable workflow that defines intended use, baselines, validation rules, monitoring, and remediation ownership.
- Use sample-based reviews to test semantic correctness where automated validation can’t determine whether a relationship makes sense.
- Apply Context Engineering to keep quality work aligned with changing data, business rules, governance, and AI use.
Why Knowledge Graph Data Quality Needs More Than Record-Level Checks
A plotted graph shows values as points and lines. A knowledge graph represents business entities and the relationships, attributes, and evidence that give those connections meaning. That difference changes what quality teams need to test. A customer record can be accurate, a supplier record can be accurate, and the link between them can still be outdated, incomplete, or unsupported.
Knowledge graph data quality is the fitness of its entities, relationships, and supporting evidence for the business decisions the graph is intended to inform. This goes beyond conventional record-level data quality, which often focuses on whether individual fields are populated, valid, and consistent. A graph must also represent how things relate, why a relationship is asserted, and whether that connection remains relevant to its intended use.
That’s why a dashboard showing clean records can create false confidence. A graph used to trace supplier dependencies, for example, needs more than correctly spelled company names. It needs defensible links between suppliers, contracts, products, and operational events. The enterprise knowledge graph guide explains how these connections support enterprise intelligence. Quality measurement must establish whether they’re reliable enough for that role.
What does data quality mean in a knowledge graph?
Nodes represent entities such as customers, products, or departments. Edges encode relationships, such as “supplies” or “owns.” Properties describe attributes of nodes or edges, while provenance records where a claim came from and how it was derived. For a foundational overview of the model, see What is a Knowledge Graph?
Quality depends on intended business use. A relationship can be syntactically valid, with the expected subject, predicate, and object, yet still lack business meaning or reliable evidence. A useful assessment asks whether the graph follows its schema and whether each important connection is meaningful, supported, and fit for the decision it may influence.
Why do weak relationships undermine graph trust?
Consider a supplier whose identity and address are correct, but whose relationship to a product line reflects an expired contract. Searches may surface the supplier as current, analytics may misstate dependency, and an AI system may use the stale link when explaining a recommendation. Accurate nodes can’t compensate for a defective edge.
Diagnose the source before assigning blame. If source data is stale or the relationship was mapped incorrectly, the issue is a data-quality defect. If the graph is accurate but an application retrieves the wrong subgraph, investigate retrieval logic. If an AI system misinterprets sound evidence, examine model reasoning and prompts. Separating these causes helps teams fix the right layer.
Test a relationship’s validity, supporting source, and relevance date alongside the entities it connects. Record the evidence behind the link and the business use that depends on it. This makes trust examinable and gives teams a clearer basis for deciding whether graph-derived search, analytics, or AI outputs are dependable enough to use.
Which Knowledge Graph Data Quality Dimensions Should You Measure?
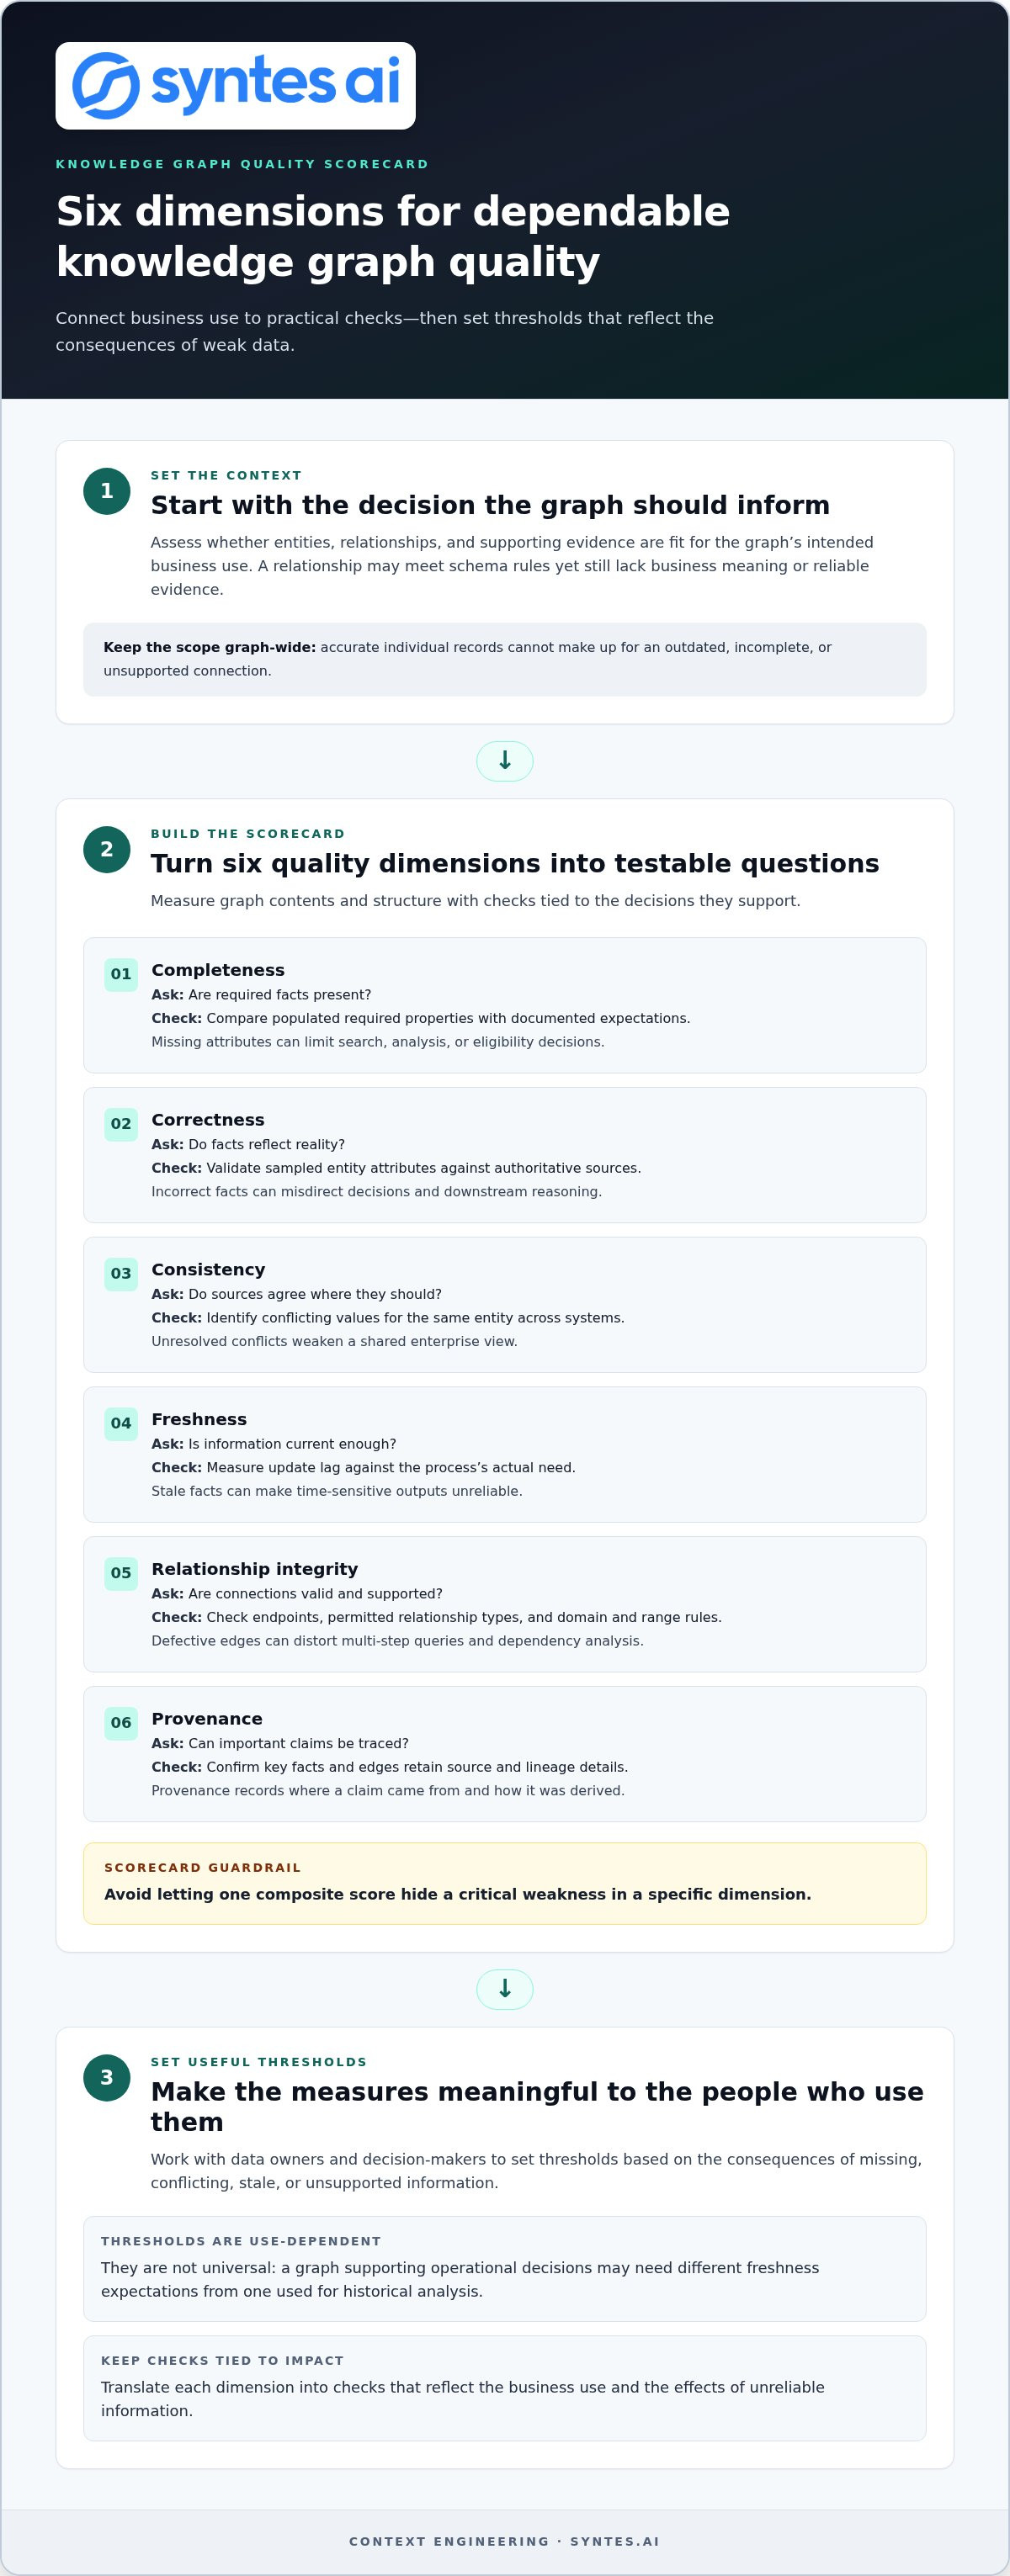
Measure the graph’s contents and structure. A practical scorecard covers completeness, correctness, consistency, freshness, relationship integrity, and provenance, then translates each dimension into checks tied to a business use. These dimensions are broadly useful, but thresholds aren’t universal. A graph supporting operational decisions may need different freshness expectations from one used for historical analysis.
Use the comparison below to turn abstract dimensions into testable questions. Set thresholds with the data owners and decision-makers who understand the consequences of missing, conflicting, stale, or unsupported information. Research in data engineering, including work published in the IEEE Transactions on Knowledge and Data Engineering, offers a wider technical context for graph systems and data management.
| Dimension | Question | Example check | Operational significance |
|---|---|---|---|
| Completeness | Are required facts present? | Compare populated required properties with documented expectations. | Missing attributes can limit search, analysis, or eligibility decisions. |
| Correctness | Do facts reflect reality? | Validate sampled entity attributes against authoritative sources. | Incorrect facts can misdirect decisions and downstream reasoning. |
| Consistency | Do sources agree where they should? | Identify conflicting values for the same entity across systems. | Unresolved conflicts weaken a shared enterprise view. |
| Freshness | Is information current enough? | Measure update lag against the process’s actual need. | Stale facts can make time-sensitive outputs unreliable. |
| Relationship integrity | Are connections valid and supported? | Check endpoints, permitted relationship types, and domain and range rules. | Defective edges can distort multi-step queries and dependency analysis. |
| Provenance | Can important claims be traced? | Check whether key facts and edges retain source and lineage details. | Traceability supports review, explanation, and remediation. |
A single aggregate score can conceal a critical graph defect by averaging a serious relationship or provenance failure with strong results in less consequential dimensions. Keep dimension-level results visible and define use-case-specific thresholds for the risks that matter most.
How do you assess entities, attributes, and relationships?
Start with documented business expectations. Which properties are required for each entity type? Which relationships are allowed, and what evidence supports them? Measure required-property coverage, detect likely duplicate entities, and verify that every relationship points to valid endpoints. Then test domain and range rules in the graph model, such as whether a “reports to” edge connects the appropriate entity types.
How do freshness, consistency, and provenance affect trust?
Set freshness limits according to the business process, not an arbitrary schedule. Compare values across systems, retain lineage so teams can identify where a conflict originated, and track evidence for high-impact facts and relationships. These checks distinguish a timely, traceable assertion from one that merely appears complete.
For teams applying these measures to an enterprise knowledge graph, understanding how graph context is assembled can help connect quality criteria to operational use.
How Can You Tell Whether a Knowledge Graph Quality Score Is Meaningful?
A quality score is meaningful only when it tells decision-makers what is reliable, what is at risk, and what to investigate next. No universal number represents every graph or business use. A score designed for historical analysis may obscure defects that matter in a live operational workflow. Treat knowledge graph data quality as a set of measurable signals tied to intended use, not as a single grade that settles every question.
Two reporting approaches help. A dimension-by-dimension scorecard shows separate results for completeness, correctness, freshness, relationship integrity, and provenance. A weighted composite combines selected measures into one summary, assigning greater influence to dimensions considered more consequential. The scorecard supports diagnosis; the composite can help leaders track a high-level trend. Neither is useful unless its underlying measures and assumptions stay visible.
When should teams use a scorecard instead of one score?
Use a scorecard when defects have materially different consequences. A missing optional description and an unsupported relationship used in a critical decision shouldn’t count as equivalent failures. A weighted roll-up can conceal the latter if strong results in lower-risk dimensions compensate for a weak high-risk measure. If you publish a summary indicator, show its component scores and flag any critical dimension that falls below its own threshold.
For example, a hypothetical composite of 92 could look healthy even if provenance is weak for relationships behind a consequential workflow. The summary number says little unless readers can see how it was calculated, which measures were included, and whether any high-impact check failed. Make the score explainable, not merely easy to display.
How do you set useful thresholds and benchmarks?
Set thresholds by use case, data criticality, and tolerance for error. A graph used to explore historical trends may accept older updates than one informing a time-sensitive operational decision. Document why each threshold exists, who owns it, and what action follows when it’s breached. Don’t present locally chosen limits as industry-wide standards. Their value comes from fitting the decision, not from universal adoption.
Establish a baseline before comparing sources, teams, or releases. Use the same definitions, sampling approach, and calculation rules across comparisons, or apparent improvement may simply reflect a changed method. When results shift, inspect the failed checks and affected graph areas before deciding whether the change signals a data defect, a process change, or a measurement issue.
Quality measures can support grounded AI by identifying whether relevant facts and relationships have evidence, suitable freshness, and traceable origins. They can’t, by themselves, guarantee that a model will reason correctly or prevent hallucinations. Retrieval, prompts, model behavior, and application logic matter too. The distinction is central to preventing AI hallucinations through semantic grounding: reliable context strengthens the basis for an answer, while governance and evaluation remain necessary to assess the output.
Use scores to direct scrutiny and remediation, not to declare a graph trustworthy once and for all. A useful measure makes risks visible and connects them to decisions, owners, and follow-up tests.
How to Measure Knowledge Graph Data Quality: A Repeatable Workflow
Reliable measurement starts with a decision, not a dashboard. Define what the graph is meant to support, then build tests that show whether its data is fit for that use. This turns knowledge graph data quality into an operational cycle: establish expectations, check performance, investigate defects, and verify that fixes hold.
- Define intended use. Identify the decisions, queries, or workflows the graph supports. Specify which entities, relationships, properties, and evidence those uses depend on.
- Set a baseline. Run initial checks and record results by quality dimension, source, and data domain. Capture the rules and sampling method so later results can be compared consistently.
- Translate expectations into tests. Convert business definitions and graph-model rules into checks for required properties, valid relationship types, endpoints, duplicate entities, and source lineage.
- Review semantic correctness. Where automated rules can’t determine whether a fact or relationship makes sense, inspect a representative sample with relevant domain owners. Record the expected result and supporting evidence.
- Assign thresholds and ownership. Document the acceptable range for each measure, the accountable owner, any approved exceptions, and the action required when a threshold is breached.
- Monitor, remediate, and retest. Track results over time, prioritize issues by their downstream decision impact, assign remediation, and rerun the same tests to verify the fix.
How do you design validation rules and test samples?
Make each rule specific enough to produce an actionable result. For example, test whether a relationship connects permitted entity types or whether a critical property is populated for the relevant class of entities. Pair automated checks with samples that represent different sources, entity types, and relationship patterns. Domain reviewers can assess whether sampled connections match business meaning and evidence, not just schema syntax.
Keep a validation record for every important test: its purpose, rule, expected result, sample approach, exception rationale, evidence, owner, and last review. This makes the test reproducible and helps teams distinguish an accepted business exception from an uninvestigated failure.
How should teams monitor and remediate quality issues?
Assign clear accountability by data domain and quality dimension. A technical team may maintain automated checks, while a business domain owner determines whether a relationship reflects current operating reality. Prioritize remediation by the decision affected, the reach of the defect, and its severity, not by raw defect count alone.
Track open issues through defined statuses, such as identified, assigned, in remediation, and retested. Rerun measurements after source updates, schema changes, or revised business rules, since each can alter what the graph represents or how a check should behave. Review trends and exceptions regularly, and close an issue only when repeatable tests show the intended correction.
A disciplined measurement cycle supports the governed context behind enterprise intelligence and AI. It doesn’t end at detection. It connects evidence, ownership, and verified remediation.
How Context Engineering Connects Graph Quality to Trusted Enterprise AI
Enterprise context changes as source systems update, relationships shift, and business rules evolve. Quality measurement therefore can’t stop after an initial cleanup or validation. It must be part of the operating discipline that maintains context over time, checking whether the graph still reflects the business conditions and evidence that AI and analytics rely on.
What changes when quality is part of Context Engineering?
Context Engineering connects quality checks to the full lifecycle: integrating data, interpreting its meaning, applying business context, governing use, and supporting execution. The Context Graph provides a live operational model of entities, relationships, and events. It is the context layer being assessed, not a quality score or guarantee. Measurement rules, thresholds, ownership, and review processes determine how teams evaluate it.
The Syntes Context Engineering Framework names five pillars. Each gives quality work a distinct operational focus:
- Connect: Assess whether structured and unstructured sources are linked to relevant entities and relationships, and whether source changes are reflected in validation.
- Understand: Check whether entity types, attributes, relationships, and business terms are interpreted according to the organization’s graph model.
- Contextualize: Evaluate whether rules, operational events, and surrounding information make a fact or relationship meaningful for its intended use.
- Govern: Define quality ownership, thresholds, evidence requirements, exceptions, and review practices so decisions about data are accountable.
- Execute: Monitor quality where context informs workflows or AI use, and feed detected issues into review and remediation.
This approach makes knowledge graph data quality continuous. A change to a source, schema, or business rule can affect what the graph represents and which tests remain valid. Review both the context and the measurement rules as these inputs evolve, rather than assuming an earlier validation remains sufficient.
How does a trusted context layer support AI agents?
Connected entities and relationships give enterprise reasoning a structured view of how information relates. For example, a system considering an operational event can use its links to relevant entities and business rules as context, rather than treating each fact as an isolated record. The value depends on the relevance and quality of that context, as well as how the application uses it.
Governance and explainability make that use easier to examine. Traceable sources and relationships can help people understand which context informed an AI response or action. Defined access and review responsibilities clarify who can use that context and who remains accountable for decisions. Quality metrics support this discipline, but they don’t guarantee correct reasoning, autonomous performance, or business outcomes.
Connect graph measurement to the governance and review practices that make enterprise AI use more explainable and accountable.
Make Graph Quality a Foundation for Enterprise Decisions
Turn measurement into an operating commitment. Choose one high-value decision that depends on connected data, then define the evidence, ownership, and review it requires. This gives teams a focused starting point and a practical way to identify where quality controls need to mature before expanding across more domains and workflows.
Strong knowledge graph data quality isn’t a badge to earn once. It’s the discipline of keeping enterprise context fit for use as information and business conditions change. With clear governance and explainable context, teams can build a more deliberate foundation for analytics and AI while keeping people accountable for how that intelligence informs action.
Syntes AI’s Enterprise AI Platform combines a live Context Graph with cross-system integrations to connect fragmented enterprise information and support governed AI agents. This gives organizations a foundation for building and maintaining operational context across data sources, business rules, and relationships.
See how Syntes AI can support your enterprise context strategy.
Start with a clear use case and make trusted context part of how your organization moves forward.
Frequently Asked Questions
What is knowledge graph data quality?
Knowledge graph data quality describes whether graph information is suitable for a particular task, such as finding account dependencies or answering questions about product ownership. It concerns not only whether an entity’s details are correct, but whether the graph represents the right connections and has enough evidence to support them. A graph can be useful for one analysis and insufficient for another, so quality must be judged against the decisions it serves.
How do you measure data quality in a knowledge graph?
Start by identifying a specific query or business decision the graph supports, then test the data that query depends on. For a customer-support use case, for example, verify that sampled customer accounts resolve to the right organization and that relevant product or service relationships reflect current source information. Combine automated rule checks with human review for claims whose meaning can’t be validated from structure alone. Record failures so results can be compared after fixes.
What metrics are used to measure knowledge graph quality?
Common measures include required-property coverage, duplicate entity rate, conflicting-value rate, update lag, invalid relationship endpoints, and the share of important facts with traceable sources. Teams can also track how often sampled relationships pass domain review. Choose metrics that reveal a specific operational risk. For example, a low duplicate rate won’t tell you whether a relationship is outdated, so report measures separately rather than treating one as a proxy for all graph quality.
Can a knowledge graph be accurate if some data is missing?
Yes. The facts present in a graph may be correct even when other expected information is absent. Accuracy and completeness are separate: a product’s recorded supplier may be accurate, while a missing alternate supplier makes the graph incomplete for contingency planning. The key is to identify which missing information matters for the intended task. Make uncertainty visible rather than allowing users or AI systems to mistake absence for evidence that no relationship exists.
How often should knowledge graph data quality be checked?
Set review timing according to how quickly the underlying information changes and how consequential a stale result would be. A graph that reflects frequently changing inventory may need more frequent checks than one used for stable reference information. Run additional validation after a source integration, schema revision, or business-rule change. Event-triggered testing catches change-related risks, while scheduled reviews help identify gradual drift that no single update may reveal.
What is the difference between knowledge graph data quality and data governance?
Data quality describes the condition and suitability of graph information. Data governance establishes the decision rights and controls for managing that information, including who defines terms, approves exceptions, and addresses issues. For example, a metric may reveal inconsistent supplier identifiers; governance assigns responsibility for deciding the canonical identity and authorizing a correction. Quality provides evidence about the data, while governance provides the accountability and process for acting on that evidence.
Does better knowledge graph data quality eliminate AI hallucinations?
No. Better-quality graph context can give an AI system more relevant, traceable information to draw on, but it can’t guarantee that the system will interpret or communicate that information correctly. Hallucinations can also arise from retrieval choices, model behavior, prompts, or application design. Evaluate the full path from source data to generated response, and make it possible to inspect what context informed an answer. Human review remains important for consequential decisions.