

How do you prove a knowledge graph will deliver business value before approving the investment? A credible knowledge graph business case starts with a business problem, not a platform pitch. Executives are right to question benefits that sound abstract, especially when data is fragmented and existing initiatives overlap. Connect the proposed capability to outcomes the organization can measure, then validate those outcomes in stages.
This guide shows how to define a focused use case, establish a baseline, and choose indicators that demonstrate progress. It also explains how to scope work across data, governance, and implementation, while distinguishing the broader knowledge graph from the graph database technology beneath it. Avoid assumed ROI and promises without evidence.
You’ll learn how to build a transparent measurement plan, surface delivery risks such as data quality and ownership, and compare implementation choices before making a recommendation. The result is a board-ready case that makes the value, uncertainty, and next steps clear, including where a live Context Graph may support enterprise AI use cases.
Key Takeaways
- Anchor the proposal in a specific business capability and map the entities and relationships needed to support it.
- Trace how connected data could change decisions and workflows, then select measures that fit the use case.
- Compare a knowledge graph with existing data and AI approaches against relationship complexity, freshness, explainability, governance, and integration needs.
- Make the knowledge graph business case decision-ready by presenting current workflows, evidence, options, value hypotheses, risks, and a clear approval request.
- Translate approval into a phased plan, with platform criteria for live context, governance, explainability, and execution.
Why Build a Knowledge Graph Business Case Around a Business Problem?
Fund a defined business capability, not a graph for its own sake. Nodes, edges, and integrations describe technical work; they are not the business outcome. Leadership needs to know which decision, workflow, or operational constraint the investment is intended to improve, who will use the result, and how the change will be assessed.
Definition: A knowledge graph represents a business domain as connected entities and the relationships between them. Its structure describes what is connected and how. Its intended outcome is a business improvement enabled by using those connections. For a foundational overview of the concept and its technology, see Knowledge graph.
That distinction gives the knowledge graph business case a clear starting point. Consider fragmented customer context that slows service teams, inconsistent product data that complicates commerce or reporting, or operational knowledge split across systems that employees must reconcile manually. These are candidate problems, not proof that a graph is the answer. The case must show why relationships among customers, products, policies, transactions, or processes matter to the target decision, and why current tools may not represent or surface those relationships effectively.
Start with the workflow. Identify who performs it, which decisions they make, what systems they rely on, and where disconnected information creates friction. Trace a real example from the information available to the decision made, noting each manual lookup, handoff, or reconciliation. Separate observed evidence, such as repeated record reconciliation or documented handoffs, from assumptions that require stakeholder validation. If a standard database, enterprise search, or analytics can address the issue adequately, that may be the more appropriate option.
Which business problems can a knowledge graph address?
Prioritize a problem when its outcome depends on understanding connections across entities, not simply storing more data. Map each candidate to affected teams, workflow steps, decisions, and source systems. Then validate the pain with the people who experience it. A reported delay is an observation only when supported by workflow evidence; a proposed cause, such as missing relationships, remains a hypothesis until tested. For example, if employees repeatedly search separate systems to assemble a customer’s case history, document which records they need and where each one resides before deciding whether a graph would help.
What should the business case promise, and avoid promising?
State a testable value hypothesis, its intended users, and its operational boundary. For example, a proposal might test whether connecting customer and case context helps a defined service team resolve selected cases with fewer manual handoffs. Set a baseline and measurement plan before claiming improvement. Don’t guarantee ROI or universal performance, and don’t assume a graph is necessary. Explain where current databases, search, or analytics fall short for this specific use case and what evidence would change that assessment.
A disciplined case makes uncertainty visible. It gives leadership a problem to evaluate, a hypothesis to test, and a basis for deciding whether to proceed.
How Does a Knowledge Graph Create Measurable Business Value?
A knowledge graph creates business value only when connected information changes a decision or workflow. Make the chain explicit: connect relevant data, make relationships available to users or systems, change how a decision is made or work is performed, then measure the resulting outcome. If the chain stops at building nodes, edges, or integrations, the case describes technical delivery, not business value.
For a service workflow, for example, a graph might connect a customer, their products, and prior cases. The hypothesis could be that giving an assigned team this context reduces case resolution time or manual handoffs. A knowledge graph won’t produce that result automatically; users must adopt the workflow, and the measure must capture whether the intended change occurred. A Columbia University presentation on knowledge graphs in financial services provides an example of the topic in a high-stakes industry.
A business case needs a documented baseline and a measurable outcome tied to the workflow the knowledge graph is intended to change. Before implementation, specify the baseline period, measurement window, accountable data owner, and comparison method. For instance, compare the same workflow before and during a pilot, while documenting changes in workload or process that could affect the result. Define the measure precisely: note when the clock starts and stops for resolution time, or what counts as a manual handoff.
Which value drivers belong in the analysis?
Assess value pathways separately, because each has different beneficiaries and evidence:
- Process efficiency: Track resolution time, manual handoffs, or repeated information searches. The benefit depends on teams using the changed workflow.
- Information quality: Measure duplicate records or missing relationships against a defined data scope. Better information may enable improvement, but isn’t itself proof of business impact.
- Decision support: Evaluate whether users can access relevant relationships when making a specific decision, and whether that changes the decision process.
- AI grounding: Assess whether enterprise context is available and traceable for a defined AI use case. Treat this as a separate pathway from process savings.
Name who realizes each benefit and what adoption or operational change it depends on. Don’t count reduced handling time and fewer handoffs as separate savings if they describe the same improvement. Where benefits affect different teams, identify the team that owns the measure and the one that experiences the change.
How can leaders measure value without inventing ROI?
Use organization-specific baseline data, and label evidence as measured, modeled, or strategic. During a pilot, track leading indicators such as context availability, data coverage, and workflow adoption. After the workflow is in use, assess outcome measures such as resolution time or duplicate-record rates. Assign owners and disclose assumptions behind any forecast.
Present sensitivity scenarios rather than a single certain return. Show how the estimate changes if adoption, data coverage, or the measured effect differs from the central assumption. This keeps the knowledge graph business case credible and gives leadership a practical basis for deciding what to validate next. If a live Context Graph is among the options under review, explore how it may fit your evaluation criteria.
Knowledge Graph vs. Existing Data and AI Approaches: What Should You Compare?
Compare architectures against the same validated use case, not against an abstract idea of what a knowledge graph can do. A relational database may already handle structured records effectively. Enterprise search can surface relevant documents, while retrieval-augmented generation (RAG) brings selected content into a model’s response. A knowledge graph represents entities and their relationships. These approaches can work together, but each adds different capabilities and operational demands.
Use the comparison to identify a genuine gap. If a decision depends on tracing relationships across systems, entity types, or business rules, a graph may offer a useful representation. If users need to find documents or query well-structured records, existing search or database capabilities may be enough. Don’t add graph complexity unless the use case requires it. Include the current approach in the evaluation and check whether the proposed option introduces new data maintenance or governance work.
| Approach | Relationships | Freshness | Explainability | Governance and integration |
|---|---|---|---|---|
| Relational database | Structured through defined tables and joins | Depends on update processes and source design | Queries and data structures may be inspectable | Assess existing controls, schemas, and connections |
| Enterprise search | Primarily finds relevant indexed content | Depends on indexing and refresh cadence | Results can be reviewed as source documents | Assess permissions, indexing, and source coverage |
| RAG | Retrieves content; relationships may not be explicitly represented | Depends on retrieval sources and refresh processes | Can expose retrieved sources, subject to implementation | Assess retrieval controls, source quality, and connections |
| Knowledge graph | Represents entities and defined relationships | Depends on source updates and graph maintenance | Relationships and provenance can be inspectable if designed for it | Assess modeling, ownership, governance, and integration effort |
When does a knowledge graph add distinct value?
Look for decisions that require connections among multiple entity types or systems, such as understanding how a product, supplier, incident, and policy relate. Also test whether users need to inspect business rules, data origins, and connected context. If relationships aren’t central to the decision, a database query or search may be simpler and sufficient. A practical test is to take representative questions from the workflow and check whether answering them requires following relationships across sources or simply finding a record or document.
How should RAG, GraphRAG, and knowledge graphs be evaluated?
RAG retrieves relevant content for a model; a graph represents relationships that retrieval can use when those connections matter. GraphRAG combines graph-based context with retrieval, but it isn’t automatically preferable. Compare options on the same test cases, examining preparation and maintenance effort, source freshness, governance, and whether users can trace how an answer was formed. Include questions that reflect the actual task, and review the supporting information as well as the response.
The strongest knowledge graph business case compares alternatives against documented requirements and operational constraints. Select the simplest architecture that meets them, and treat any additional complexity as something to justify, not assume.
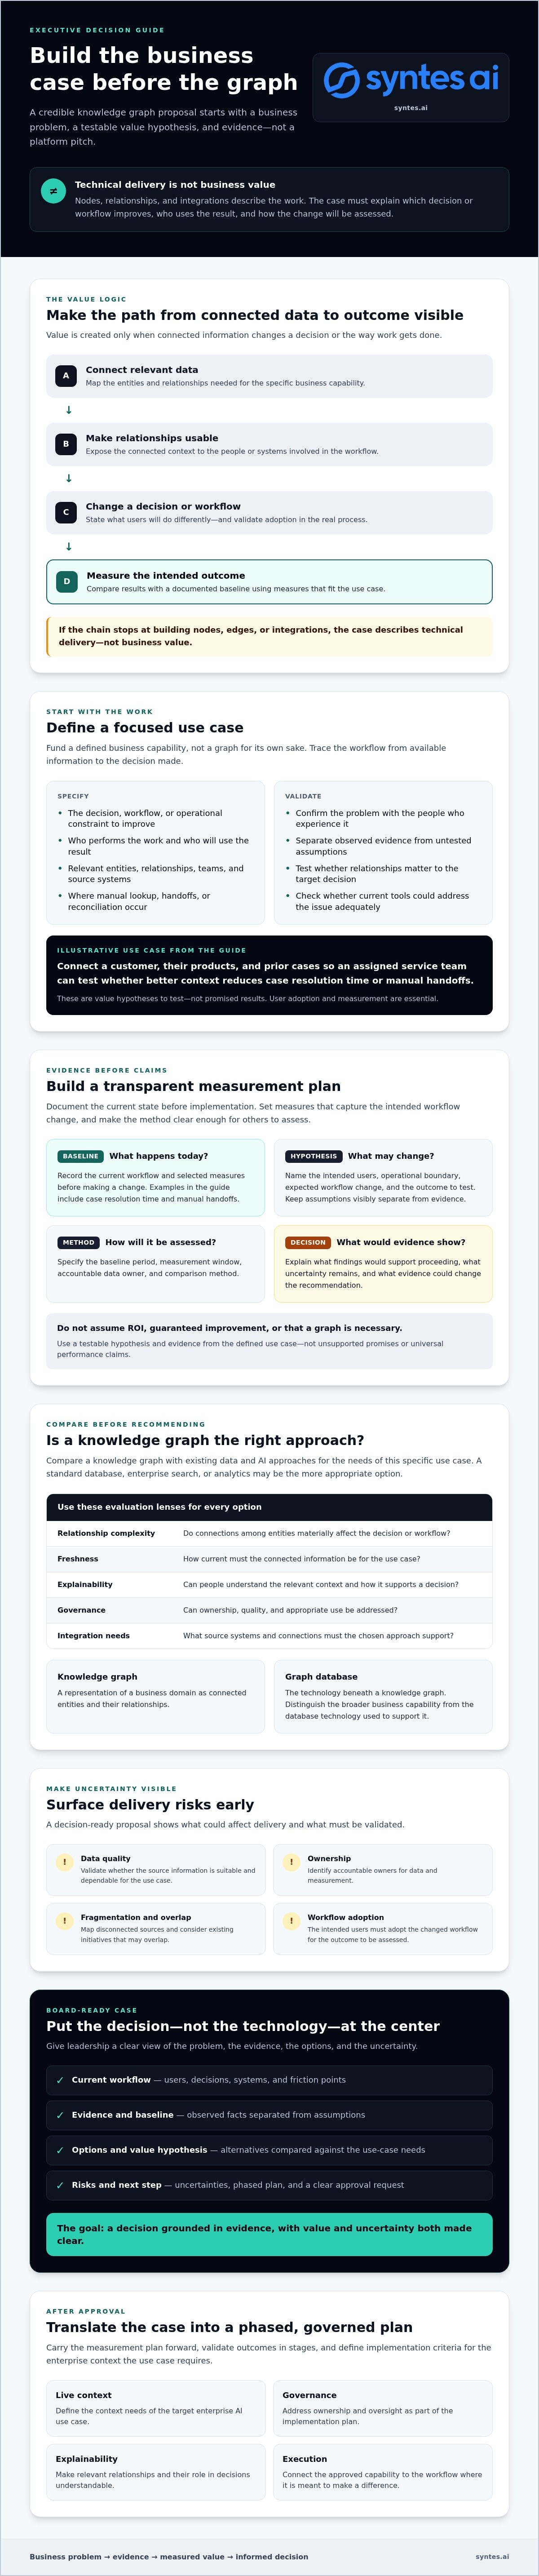
How to Build a Knowledge Graph Business Case for Executive Approval
Executives need a decision, not an architecture tour. Shape the presentation around one bounded use case and the evidence required to approve its next step. Lead with the operational problem, show how work and information move today, then explain why a knowledge graph is one option worth validating.
What should an executive knowledge graph presentation include?
Use a concise sequence: decision summary, problem and evidence, current workflow, options, value hypothesis, risks, and requested approval. Include maintaining the status quo as a legitimate option. Place forecast assumptions beside the relevant metrics, and name who must validate them. Close with the accountable sponsor and the next validation milestone, not an open-ended request to fund a platform.
Make the scope executable. Identify the intended users, source systems, accountable business and data owners, governance requirements, and what is explicitly out of scope. Define milestones for validation and pilot assessment. Before work begins, set exit criteria: what evidence would justify scaling, changing direction, or stopping? That turns approval into a controlled decision path.
How should risks, governance, and uncertainty be presented?
State material risks plainly: data quality, access control, unclear ownership, integration dependencies, and user adoption. For each, assign an owner and a validation or mitigation step. Describe how permissions, auditability, and human review will apply where relevant. Label assumptions as confirmed, untested, or unresolved; pair each important unknown with a discovery activity or pilot measure that can reduce uncertainty.
A strong knowledge graph business case doesn’t hide uncertainty behind a single forecast. It shows the evidence behind the recommendation, identifies who is responsible for testing assumptions, and makes the approval decision specific. For example, leadership may be asked to authorize a bounded validation phase, with a later decision gate tied to agreed evidence and pilot exit criteria.
After the framework and evaluation criteria are clear, an enterprise Context Graph is one option to assess for connecting business context across systems. The next discussion should focus on fit, governance, and validation, not assumed results.
From Business Case to Governed Enterprise Knowledge Graph: Define the Next Step
Approval isn’t the finish line. It authorizes a disciplined path from business hypothesis to evidence. Move through defined gates: validate the required business context, select one bounded use case, run a pilot, assess results against agreed criteria, then decide whether to scale, revise, or stop. Each gate should have an owner and a documented decision.
What should an enterprise knowledge graph pilot prove?
Test one workflow against its baseline and acceptance criteria. Check whether the pilot covers the necessary source information, represents relationships accurately enough for the use case, respects permissions, and fits how intended users work. Measure adoption as well as technical readiness. At the end, record what the evidence supports, what remains uncertain, and whether the case for proceeding has been met.
Keep evaluation criteria tied to the approved business case. Assess:
- Integration: Can the approach connect the relevant systems within the organization’s existing architecture?
- Live context: Can it maintain the information and relationships the use case depends on as source context changes?
- Governance and explainability: Can the organization manage access and inspect how information informs decisions?
- Agent execution: If agents are in scope, can their reasoning and actions be governed appropriately?
Confirm specific capabilities, integration fit, and deployment details directly with the platform provider during evaluation. Don’t treat a product description as proof that it meets your requirements.
How can a platform support the approved business case?
After defining neutral criteria, consider whether Syntes AI’s Context Engineering approach aligns with the use case. Syntes AI describes its Context Graph as a continuously evolving operational model for connecting enterprise context. That is a platform approach to evaluate, not a guarantee of measurable business outcomes; the pilot must establish whether it fits the organization’s data, workflows, and governance needs.
The Syntes Context Engineering Framework describes five pillars: Connect relevant information, Understand it, Contextualize it for business use, Govern how it is accessed and applied, and Execute through governed actions. Use these as evaluation prompts, asking what each stage means for the approved scope and how it will be validated.
A credible knowledge graph business case ends with a decision gate, not an assumption that a successful pilot must scale. Compare evidence with the agreed measures, document risks and unresolved dependencies, and recommend a clear next step. For an evaluation conversation, book a Syntes AI demo.
Turn the Business Case Into a Measured Next Step
A compelling knowledge graph business case starts with a defined business problem, not a technology purchase. Tie the proposed capability to a measurable workflow outcome, compare it with simpler alternatives, and make the assumptions, risks, and evidence requirements visible to leadership.
Then proceed in stages. Validate the context, test one bounded use case against agreed measures, and use the results to decide whether to refine or scale. Governance and explainability belong in that decision alongside operational value.
Syntes AI focuses on Context Engineering and a live operational Context Graph. Its framework moves through Connect, Understand, Contextualize, Govern, and Execute, providing a structure to consider as you assess how enterprise context could support your priorities. The fit should be validated against your requirements, architecture, and pilot evidence.
Make the next step deliberate. With a clear hypothesis and a transparent validation plan, your organization can move from fragmented information toward better-grounded decisions with confidence.
Frequently Asked Questions
What is a knowledge graph business case?
A knowledge graph business case explains why an organization should invest in representing connected business information to address a defined problem. It links the proposed capability to intended users, workflow changes, measurable outcomes, alternatives, risks, and a validation plan. The graph itself represents entities and their relationships within a business domain. The case should distinguish that technical structure from the business result it aims to support, and make assumptions explicit for decision-makers.
How do you calculate the ROI of a knowledge graph?
Calculate ROI using organization-specific evidence, not an assumed industry return. Establish a baseline for the selected workflow, define the measurement period, and track attributable benefits alongside implementation and operating costs. A standard calculation is (quantified benefits minus costs) divided by costs, but the inputs need clear definitions and accountable owners. Separate measured results from forecasts, disclose assumptions, and test sensitivity to adoption or impact. Don’t present an estimate as a guaranteed return.
What business problems can a knowledge graph solve?
A knowledge graph may support problems where decisions depend on relationships among information spread across systems. Examples include assembling fragmented customer context for service teams, reconciling inconsistent product information, or connecting operational events to relevant policies and records. First map the affected workflow, users, systems, and decision. Then verify the pain with evidence and test whether connected relationships are central to addressing it. If not, a simpler data or search approach may be sufficient.
How is a knowledge graph different from a database?
A database stores and retrieves data; a knowledge graph organizes information around entities and their relationships. A graph database can provide the underlying storage and query technology, while a knowledge graph also involves the model that defines concepts and connections, plus the processes and governance used to maintain them. Relational databases can represent relationships too. The distinction isn’t that one replaces the other, but whether an explicit graph model suits the use case.
Is a knowledge graph better than RAG for enterprise AI?
Neither is universally better. RAG retrieves relevant content to provide a language model with context, while a knowledge graph explicitly represents entities and relationships. Graph-based retrieval, sometimes called GraphRAG, may be worth evaluating when a documented use case requires connections across sources or traceable relationships. Compare approaches using the same questions, data, and governance criteria. If ordinary retrieval meets the need, adding graph complexity may not be justified.
How long does it take to build an enterprise knowledge graph?
There’s no reliable universal timeline. The effort depends on the use case’s scope, source-system readiness, data quality, relationship complexity, governance needs, and stakeholder availability. Define a bounded pilot before estimating delivery: identify the workflow, required sources, owners, baseline measures, and acceptance criteria. Assess the evidence and dependencies at a decision gate before planning expansion. A phased estimate based on validated scope is more credible than a generic duration.
What should a board presentation about a knowledge graph include?
Lead with the decision requested and one clearly scoped business problem. Show evidence of the current pain, the workflow and data dependencies, and options that include existing systems or maintaining the status quo. Present the value hypothesis, baseline measures, assumptions, risks, governance needs, accountable owners, milestones, and pilot exit criteria. End with the specific approval needed and the next validation step. Keep technical architecture in service of the decision, not as the opening pitch.