
A dashboard can show that a shipment is late. By itself, it can’t explain which supplier dependency, production constraint, or disruption caused the delay. A supply chain knowledge graph connects those signals, revealing the relationships behind operational status.
If your teams piece together data from business systems and documents, the problem may not be a lack of dashboards. It may be a lack of shared context. Without clear links between suppliers, products, transactions, rules, and events, decision-makers can struggle to trace disruptions, and AI may lack the business context to recommend a reliable next step.
This guide explains how a supply chain knowledge graph supports connected visibility and what to evaluate in a platform. You’ll learn how to assess capabilities against real workflows, connect operational data and relationships into useful context, and evaluate governance and explainability for trusted decisions and automation. We’ll also explore how Context Engineering and a live Context Graph can provide a unified context layer for supply chain intelligence.
Key Takeaways
- Assess whether a supply chain knowledge graph connects the entities, relationships, rules, and events your teams need to analyze.
- Trace how platform data moves from source systems through entity resolution and relationship modeling into operational context.
- Compare platforms on data coverage, freshness, governance, explainability, and support for execution.
- Test platform fit against a bounded workflow, such as tracing a delayed order across supplier and shipment dependencies.
- See how Syntes AI’s Context Engineering Framework connects, understands, contextualizes, governs, and executes enterprise context.
Why a Supply Chain Knowledge Graph Can Reveal More Than a Visibility Dashboard
A status update tells you what happened. Operational visibility also requires understanding what the event connects to, which decisions it may affect, and what evidence supports that interpretation. A dashboard can report a delayed order, for example, but the status alone may not show which shipment carries its components, which facility depends on their arrival, or whether another supplier can meet the need.
A supply chain knowledge graph represents supply chain entities and the relationships, rules, and events that connect them. This structure gives data meaning, so teams can examine not only individual records but also how those records relate across systems. For a foundational overview of the concept, see What is a Knowledge Graph?
The distinction is practical: descriptive monitoring surfaces a condition, while relationship-based analysis helps investigate its dependencies and possible downstream effects. A graph makes relevant connections available for analysis, but it doesn’t guarantee that every dependency is captured or that a disruption will be predicted. The quality of the picture depends on the data and relationships represented.
What makes supply chain data a graph?
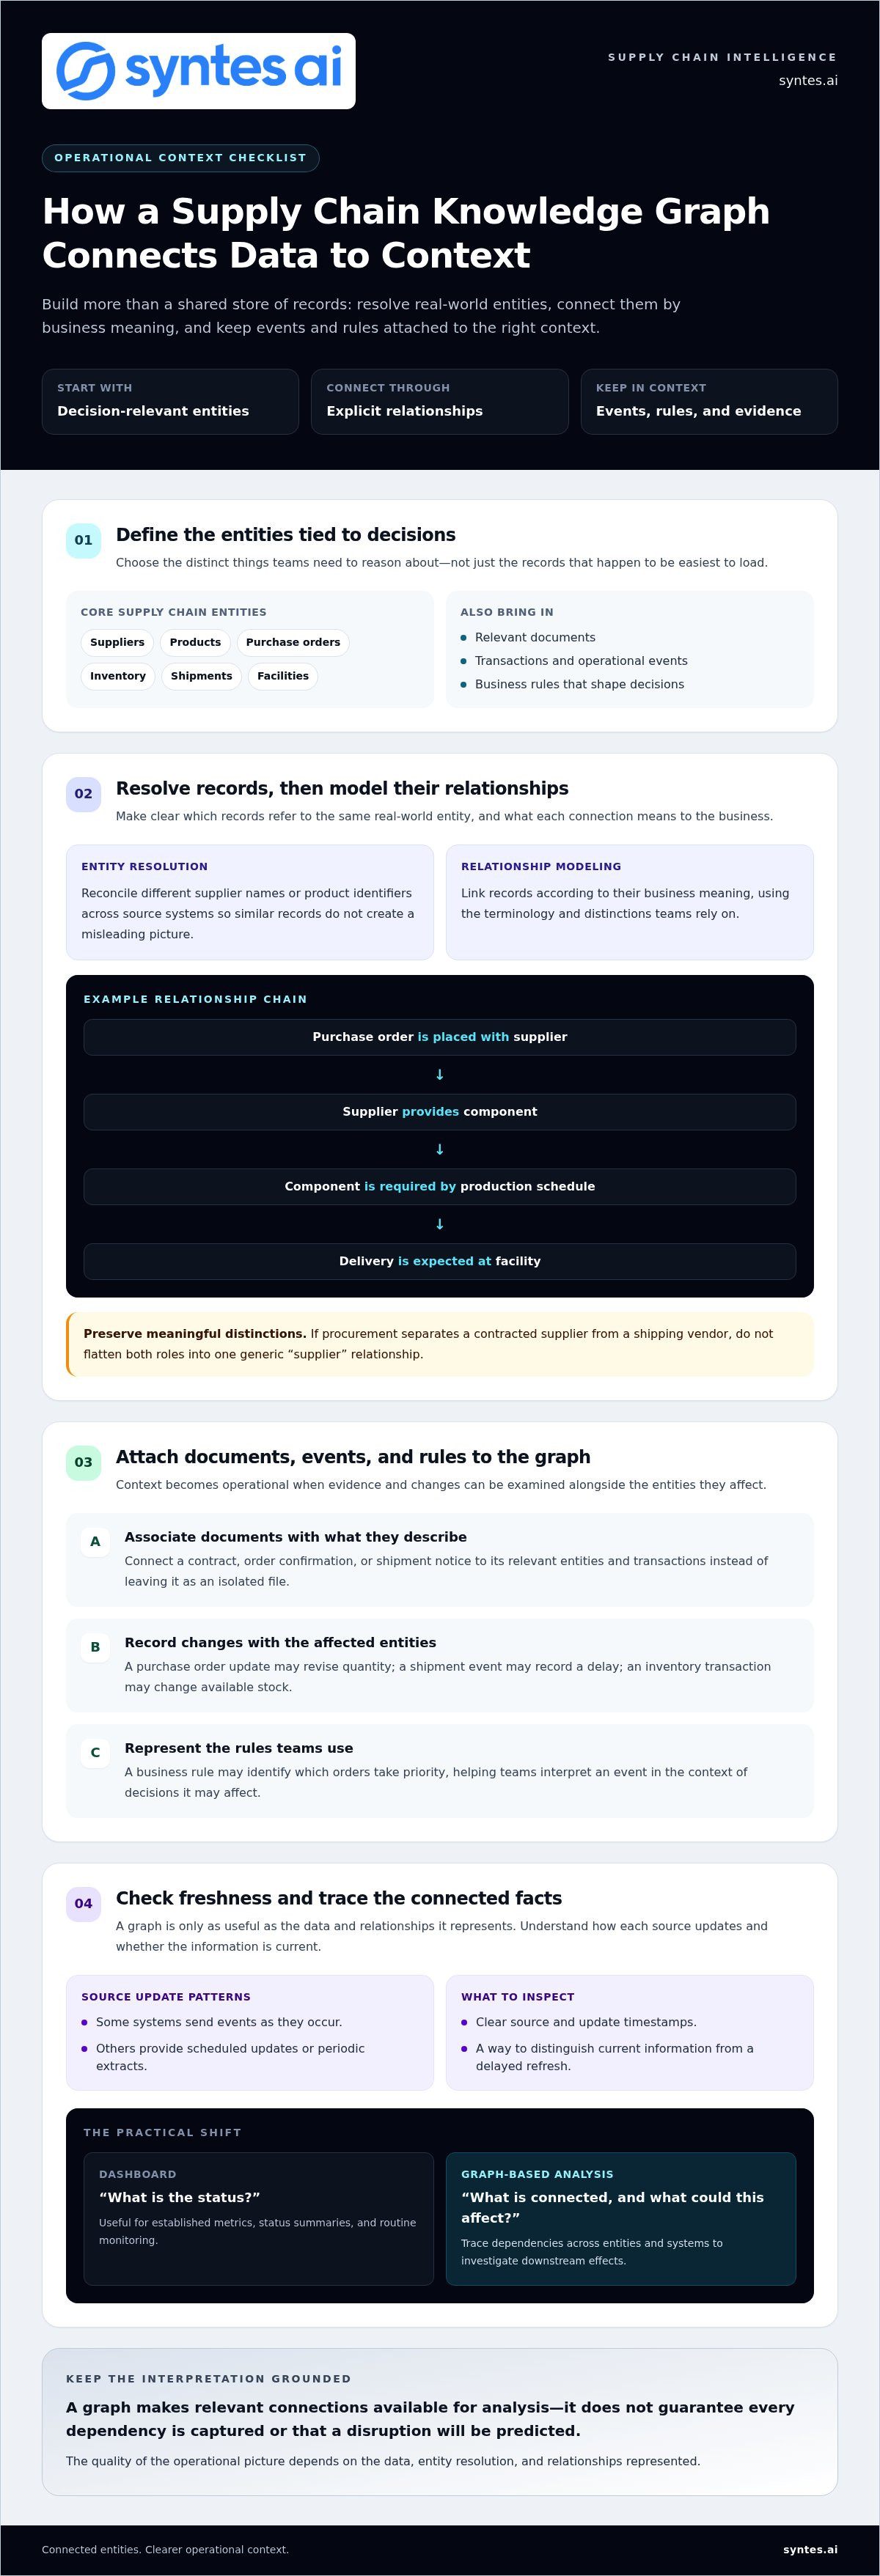
A graph starts with entities, the distinct things a business needs to reason about: suppliers, products, facilities, orders, shipments, and inventory. It connects them through explicit relationships such as “supplies,” “ships,” “depends on,” “contains,” and “is delayed by.” For example, a shipment can be linked to the order it serves, the supplier that dispatched it, and the facility expecting its contents.
Documents, business rules, transactions, and operational events add context to those connections. A purchase order may establish quantities and commitments; a delay event may update a shipment’s status; a business rule may identify which orders take priority. Together, these elements let analysts follow a chain of related facts instead of searching for each record in isolation.
When is a graph more useful than a dashboard?
Dashboards work well for established metrics, status summaries, and routine monitoring. They can show late shipments, inventory levels, or supplier performance in a consistent view. Use them to answer recurring questions with known measures.
Graph-based analysis is more useful when a question crosses entities or systems: Which customer orders depend on a delayed shipment? Which products use a particular component? Which facilities could be affected by a supplier disruption? By tracing relationships, teams can investigate dependencies that a single metric may not reveal. A knowledge graph can complement analytics and dashboards rather than replace every tool.
The buyer’s key test is whether a platform helps move from “What is the status?” to “What is connected, and what could this affect?” That shift turns visibility from a collection of updates into a basis for informed investigation and decision-making.
How a Supply Chain Knowledge Graph Connects Data to Operational Context
Connecting supply chain data takes more than loading records into a common store. A supply chain knowledge graph must establish which records refer to the same real-world entity, model how those entities relate, and preserve enough business meaning for people and systems to use those connections. Without that groundwork, similar supplier names or mismatched product identifiers can create a misleading picture.
Connected entities and relationships give supply chain reasoning the context to interpret operational facts in relation to one another.
Which supply chain entities and relationships matter?
Start with the entities tied to decisions: suppliers, products, purchase orders, inventory, shipments, facilities, and relevant documents. Then define the relationships that make those entities meaningful together. A purchase order is placed with a supplier; that supplier provides a component; the component is required by a production schedule; and a delivery is expected at a facility.
Source systems may describe the same supplier or product differently. Entity resolution helps reconcile those representations, while relationship modeling links records according to their business meaning. The model should use the organization’s terminology and reflect how its teams make decisions. If procurement distinguishes a contracted supplier from a shipping vendor, for example, those roles shouldn’t be flattened into one generic “supplier” relationship.
This structure also makes documents useful in context. A contract, order confirmation, or shipment notice can be associated with the entities and transactions it describes instead of treated as an isolated file. The result is a navigable model of dependencies, not merely a collection of normalized fields.
How do events and business rules make the graph operational?
Transactions and operational events can change the context around an entity. A purchase order update may revise a quantity; a shipment event may record a delay; an inventory transaction may change available stock. When these events are associated with the relevant supplier, product, order, and facility, an analyst can examine what changed and which connected processes may need attention.
Freshness depends on how each source supplies its data. Some systems send events as they occur; others provide scheduled updates or periodic extracts. Buyers should look for clear source and update timestamps, and a way to distinguish current information from a delayed refresh. An auditable event history can show what the model received and when, but it doesn’t guarantee that every source is perfectly current.
Rules and permissions shape what can be done with this context. Service commitments, inventory thresholds, sourcing constraints, and escalation policies can be connected to the processes they govern. Access controls determine which relationships and records an analyst or AI agent is authorized to use. That boundary matters: a decision is only as appropriate as both its business rules and its permitted evidence.
For organizations assessing how connected enterprise data can support operational reasoning, explore Syntes AI’s Context Graph, which brings relationships, events, and governed context together.
How to Compare Supply Chain Knowledge Graph Platforms
Evaluate a supply chain knowledge graph platform on more than its ability to connect data or display a network diagram. The decisive question is whether it can assemble reliable operational context, show how that context was formed, and support governed analysis or action. Use the criteria below to compare platforms against your organization’s systems and workflows.
Capability
What to evaluate
Data coverage
Can it connect the structured records and unstructured documents relevant to your workflow? Review which sources are supported and what data each integration makes usable.
Relationship modeling
Can it resolve entity identity and represent business relationships across sources, rather than simply placing records side by side?
Freshness
Can users distinguish event-driven updates from scheduled refreshes and inspect source timestamps?
Governance
Can permissions, business rules, and policy constraints govern which data and relationships users or agents can access?
Explainability
Can users trace an insight or recommendation to its supporting records, relationships, and lineage?
Execution
Can the platform support a governed next step, with appropriate controls and an auditable record of actions?
Which platform capabilities deserve the closest scrutiny?
Test how the platform identifies entities across systems, handles duplicate or conflicting records, and preserves relationships as information moves between sources. A connector count alone says little: one integration may expose detailed records, while another may provide only limited fields or periodic extracts. Assess coverage against the data your workflow needs, including documents as well as structured systems.
Then inspect an insight from end to end. Can users see its evidence, lineage, and reasoning? Do access controls and business rules apply to both analysis and actions, with an audit trail showing what was used or changed? Search and visualization help users explore, but they don’t replace these foundations.
How should buyers distinguish graph intelligence from adjacent tools?
Dashboards organize metrics and status; graph capabilities model relationships and support exploration across connected entities. Search and retrieval can find relevant documents, while relationship-aware retrieval can also use persistent links among documents, entities, and events. Workflow automation executes steps, but buyers should establish whether those steps draw on governed enterprise context or only fixed triggers and inputs.
Platform fit depends on operational context, governance, and integration requirements. Compare solutions using the same representative workflow and evidence set. This makes it easier to distinguish a connected context layer from tools that primarily monitor, retrieve, visualize, or execute in isolation.
How to Evaluate a Supply Chain Knowledge Graph Against Real Workflows
A platform should prove its value against an operational decision, not a polished demonstration detached from daily work. Choose a bounded use case that crosses systems and has a clear owner. Tracing a delayed order, for example, can reveal whether the graph connects the supplier, purchase order, shipment, production need, and evidence teams use to decide what happens next.
Use this sequence to structure the evaluation:
- Select a workflow. Pick a recurring decision involving multiple systems, entities, teams, or business rules. Define where the process starts and which operational question it must answer.
- Trace the required data. Identify the records, documents, relationships, and source systems users rely on. Note gaps, duplicate identifiers, and who owns each data source.
- Test the context. Present representative scenarios and inspect whether the platform connects the relevant evidence into a coherent view. Include missing or conflicting information, not just a clean example.
- Review governance. Confirm how permissions, business rules, human review, escalation points, and audit records apply to analysis and any proposed action.
- Assess outcomes. Agree with operational stakeholders on baseline measures and what a useful result means before testing. Evaluate decision quality and evidence traceability without assuming a particular savings figure or implementation timeline.
Which use case should anchor an initial evaluation?
Choose a workflow narrow enough to test, but important enough to expose real complexity. A delayed order can be a useful example if understanding it requires connecting the supplier, purchase order, shipment, production schedule, and delivery dependencies. Map what planners or procurement teams need to know, which records support their response, and who is accountable for the decision. Set the test boundary and success measures with those stakeholders before comparing outputs.
How can teams test trust, governance, and usefulness?
Build test scenarios from actual operating conditions. Include incomplete records, inconsistent identifiers, conflicting dates, and cases where an expected relationship is absent. A trustworthy result should make uncertainty visible rather than conceal it behind a confident summary.
Ask users to trace an answer to relevant source records, modeled relationships, and applicable rules. Then review whether each role sees only the data it is permitted to access, whether high-impact actions require human oversight, and how exceptions are escalated and recorded. Keep analysis and execution distinct during evaluation: first establish that the context is dependable, then assess which actions can be governed appropriately.
Document findings with operational owners. Record which sources were available, where context was incomplete, whether users could verify the reasoning, and what follow-up controls the workflow would require. This gives the team a practical basis for judging whether a supply chain knowledge graph fits the process, rather than relying on feature claims alone.
How Syntes AI Applies Context Engineering to Supply Chain Knowledge Graphs
Syntes AI brings supply chain information into a shared context layer through its Context Graph, a continuously evolving operational model that connects structured and unstructured enterprise data across business systems. Rather than treating records, documents, and events as isolated inputs, the graph organizes their relationships so people and governed AI agents can reason from relevant enterprise context.
For buyers, the distinction matters: connected context can make it easier to examine what supports an insight, which business rules apply, and where human oversight belongs. Syntes AI’s Context Engineering Framework describes five pillars for building and using that context.
How does the Syntes AI Context Engineering Framework work?
The framework moves from connection to action, with governance shaping how context is used. Each pillar has a distinct role in turning dispersed information into an operational model:
- Connect: Bring relevant structured and unstructured information together from enterprise systems.
- Understand: Identify entities, relationships, hierarchies, and business semantics in the connected information.
- Contextualize: Relate records, documents, transactions, and events so applications can use them in the context of business processes.
- Govern: Apply controls and policies that guide how people and AI agents access and use enterprise context.
- Execute: Enable applications or agents to act on governed context, with appropriate oversight for the workflow.
This sequence links data foundations to operational use. Contextualization and governance aren’t afterthoughts: they help connect an agent’s reasoning to meaningful relationships and keep its use within defined boundaries.
What should enterprise buyers explore in a Syntes AI demo?
Anchor the discussion in a supply chain decision that matters to your teams. Map the systems and documents that inform it, then explore how their data and relationships could form a shared operational context layer. The goal is to examine how the model represents your organization’s meaning, not just whether information can be collected.
Use questions like these to make platform fit concrete:
- How are relevant entities and relationships represented across your systems?
- Can users inspect the records and connections behind an answer or recommendation?
- How do permissions, business rules, and human review govern access and proposed actions?
- Which workflow decisions should remain with people, and where could a governed agent assist?
Use the answers to assess whether the Context Graph aligns with your data environment and operational decision requirements. Syntes AI connects enterprise context with explainable reasoning and governed AI agents, giving teams a foundation to evaluate where contextual intelligence can support supply chain workflows.
Make Connected Visibility the Next Operational Standard
Move from platform criteria to a decision your teams need to make with greater confidence. Use that workflow to assess whether a supply chain knowledge graph can provide the context people and AI agents need, and whether its reasoning and potential actions align with your operational controls.
Explore how Syntes AI’s live operational Context Graph connects structured and unstructured enterprise data, and how Context Engineering treats governance and execution as distinct parts of the process. Bring the systems, information, and decision requirements that matter to your enterprise. The discussion can focus on the context your workflow needs, where oversight belongs, and how to evaluate platform fit against operational requirements.
Connected visibility starts with asking better questions of your data. Take the next step toward decisions grounded in context your teams can inspect and trust.
Frequently Asked Questions
Can a supply chain knowledge graph work with ERP, WMS, and TMS data?
Yes. A supply chain knowledge graph can bring information from ERP, warehouse management, and transportation management systems into a connected model. The key is to map each system’s identifiers and field meanings correctly. For example, establish how a shipment ID in the TMS relates to the outbound delivery record in the ERP. This mapping helps teams avoid treating separate system records as unrelated or matching them incorrectly.
How does a supply chain knowledge graph handle conflicting data?
A supply chain knowledge graph should preserve source details and make conflicts visible instead of silently choosing a value without explanation. If one system shows a delivery date that differs from a carrier update, users need to see both values, their origins, and their timestamps. Organizations can define precedence rules for specific data types, but those rules should be transparent and reviewable so exceptions don’t disappear from operational analysis.
Is a supply chain knowledge graph the same as a digital twin?
No. A knowledge graph represents entities and their relationships so users can explore how business information connects. A digital twin typically represents an asset, process, or system and may be used to monitor or simulate its state. The approaches can complement each other: a graph could connect a facility model to suppliers, orders, or inventory records, while the twin represents the facility’s modeled operation.
How can organizations measure the value of a supply chain knowledge graph?
Start by measuring a defined workflow before and during an evaluation. For example, track how long planners take to assemble the evidence needed to investigate an exception, how often they need manual cross-system lookups, and whether they can trace a recommendation to its supporting records. Agree on definitions and data sources with operational stakeholders. Treat changes as evidence to assess, not as guaranteed savings or outcomes.
Does a supply chain knowledge graph replace a data warehouse or data lake?
Usually, no. Data warehouses and lakes support storage, reporting, and analytical workloads; a knowledge graph adds a way to represent and query relationships among data. An organization may use these technologies together, with the graph drawing on records held elsewhere. The right architecture depends on existing systems and use cases. Define which component owns source data, which models relationships, and how updates flow between them.
Can AI agents take action using a supply chain knowledge graph?
Yes. Governed AI agents can use connected enterprise context to support operational tasks, but action permissions and oversight should be designed for each workflow. For instance, an agent might prepare a proposed response to a supplier delay while a planner approves any change to an order. Separate read, recommendation, and execution permissions, and retain records of the context and approvals associated with consequential actions.
What makes a supply chain knowledge graph trustworthy?
Trust depends on more than graph structure. Users need to understand where information came from, when it was updated, how entities were matched, and which rules shaped an answer. Access controls should limit exposure to authorized users, while validation processes address incomplete or inconsistent records. Test representative scenarios, including exceptions, and make uncertainty visible so teams can judge whether the available evidence supports a decision.