

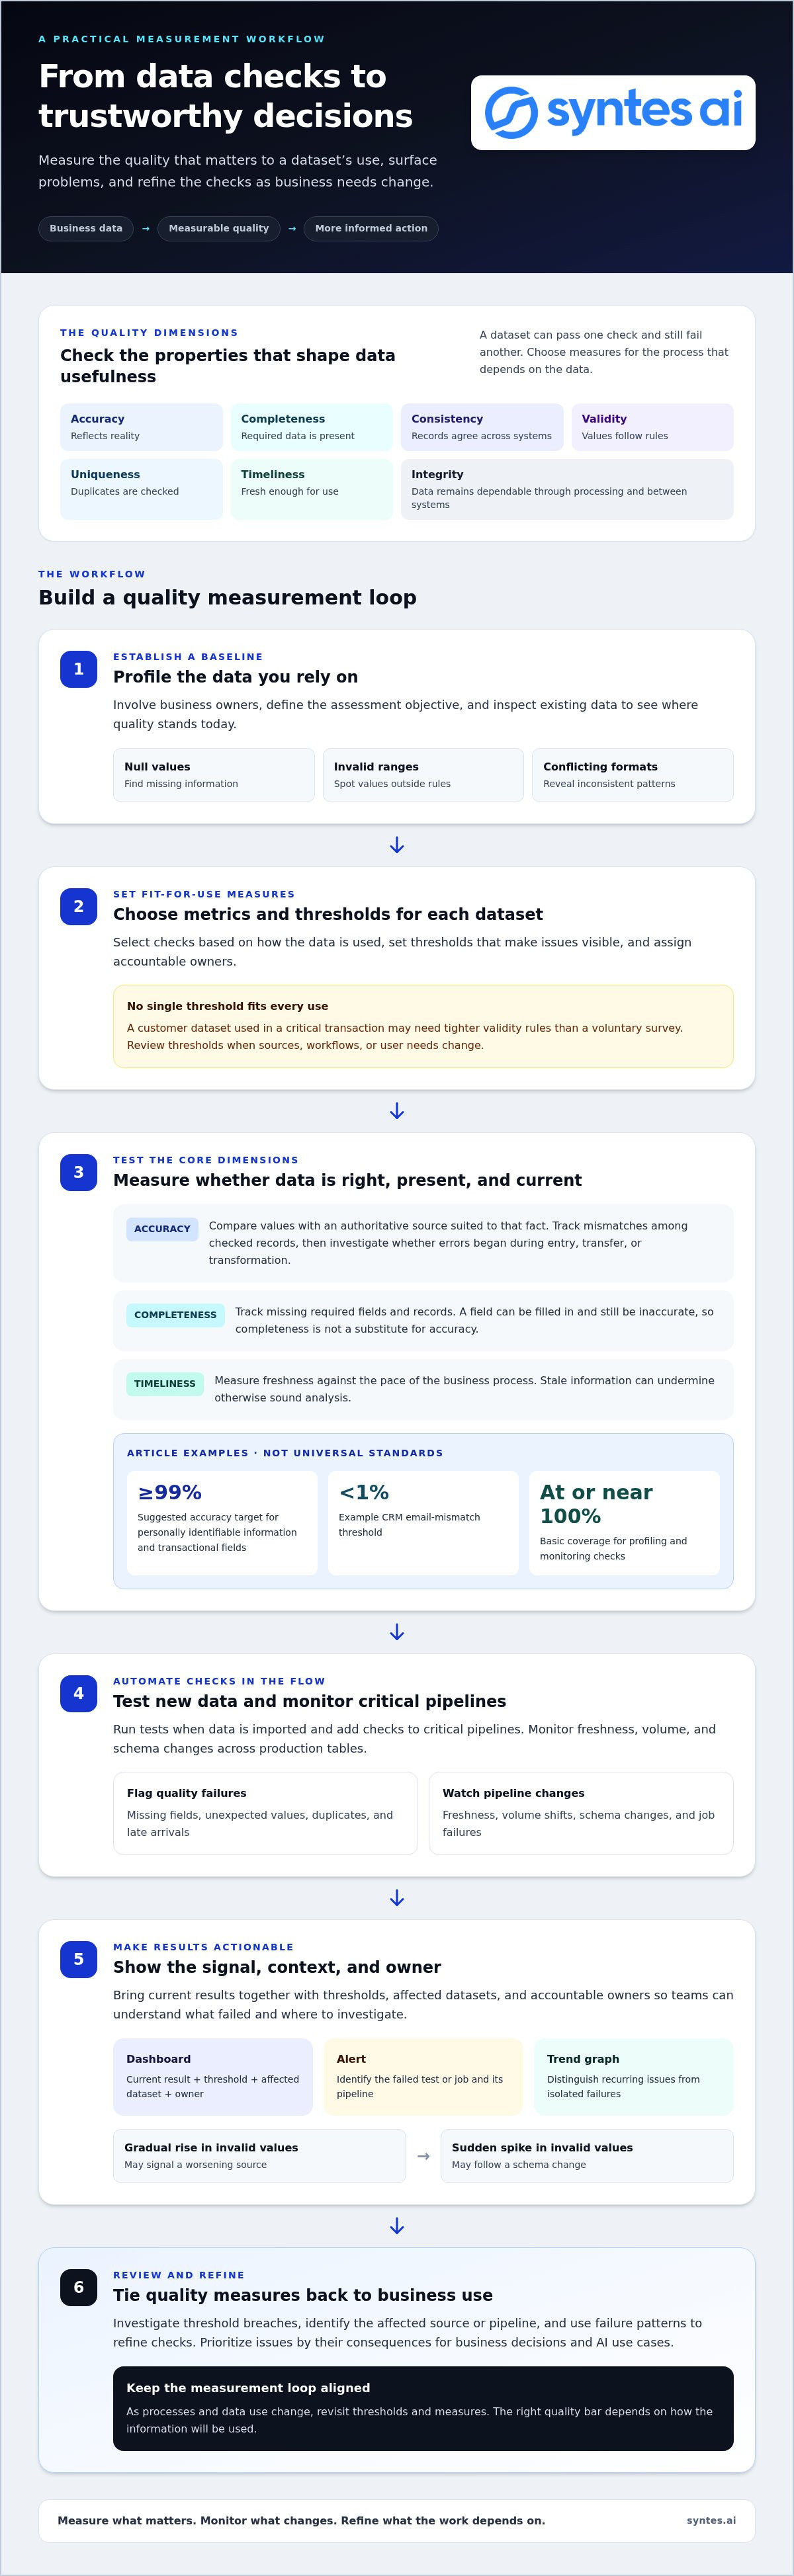
Data quality metrics for business measure whether information is accurate, complete, consistent, valid, unique, and timely enough to use. They make data quality something teams can assess, monitor, and improve. Accuracy, completeness, and timeliness are especially important: they show whether data reflects reality, contains what a process needs, and is current enough to support action.
Reliable decisions and AI depend on more than large volumes of data. Missing, incorrect, or stale records can mislead analysis and give AI systems a weak foundation. This article explains what data quality metrics measure, how to interpret core dimensions, and how to connect them to business decisions and AI. It also explains why useful thresholds depend on how data is used, rather than on a single universal standard.
Key Takeaways
- Choose metrics that reflect how each dataset is used, then set thresholds that make quality issues visible and actionable.
- Compare records with authoritative sources to assess accuracy, and track missing required fields to understand completeness.
- Measure timeliness against the pace of the business process; stale data can undermine otherwise sound analysis.
- Use dashboards, alerts, and trend graphs to spot recurring failures and shifts before they disrupt downstream work.
- Connect quality measures to business outcomes and AI use cases so teams can prioritize the data problems that matter most.
What are data quality metrics?
Data quality describes how useful a dataset is and how readily teams can process and analyze it. Metrics turn that quality into measurable evidence. They establish a baseline, reveal failure points, and help set improvement targets for critical data, such as customer records, sales transactions, or product catalogs. Data quality metrics for business teams make priorities measurable against the processes that depend on them.
A metric might track valid records as a share of all records, count errors across data points, or measure latency by source. Validity checks whether values follow business rules, accepted ranges, and required formats. A duplicate-record rate, for example, can reveal repeated customer entries that distort reports or downstream processes.
Data quality metrics for business measure properties of data itself, such as validity or completeness. Data governance defines ownership, policies, and accountability; data observability examines the health and behavior of data pipelines and systems. These disciplines work together: governance assigns responsibility, observability surfaces operational changes, and quality metrics show whether data meets defined expectations.
Businesses can monitor and improve data quality with automated tests, pipeline monitoring, alerts, and dashboards. These tools can flag missing fields, unexpected values, duplicates, late arrivals, or schema changes, then show where problems occur. A data catalog adds context through metadata such as ownership, modification date, data types, and descriptions.
Build a measurement program by involving business owners, defining assessment objectives, and profiling existing data to establish a baseline. Select metrics for the processes that rely on each dataset, set thresholds, assign accountable owners, and run tests whenever new data is imported. For example, a customer-data team could track valid email formats and missing required fields, then review trends against operational needs.
To identify issues and automate monitoring, profile datasets for patterns such as null values, invalid ranges, and conflicting formats. Add tests to critical pipelines and monitor freshness, volume, and schema changes across production tables. Basic coverage for these checks should be at or near 100%. Configure alerts to surface threshold breaches and job failures, then investigate the affected source or pipeline.
Dashboards make these signals actionable. Show current results alongside thresholds, affected datasets, and accountable owners. Alerts should identify the failed test or job, its pipeline, and where to investigate next. Trend graphs add context: a gradual rise in invalid values may signal a worsening source, while a sudden spike may follow a schema change. Reviewing trends helps distinguish recurring issues from isolated failures.
Thresholds should evolve as business processes and data use change. A customer dataset used for a critical transaction may need tighter validity rules than a voluntary survey. Review thresholds when sources, workflows, or user needs change, and refine them using observed failure patterns. ISO 8000-8 treats data quality as something to measure, not assume. These data quality metrics for business operations help keep those measurements aligned with changing priorities.
Accuracy
Accuracy measures whether data reflects the real-world objects or events it represents. A useful check compares records with a known-correct source, then tracks errors that could distort decisions.
Authoritative-Source Accuracy Checks
An authoritative-source check compares a data value with a source considered reliable for that specific fact. For example, a customer’s address can be compared with the organization’s designated address source, while transaction details can be reconciled against the system that records completed sales. The comparison must match the field’s meaning and update process. Track mismatches as a percentage of checked records, then investigate whether errors began during entry, transfer, or transformation.
Set thresholds according to the consequence of an incorrect value. A suggested accuracy target is at least 99% for personally identifiable information and transactional fields. A CRM reconciliation can also track whether email mismatches remain below 1%. These measures expose errors that a completeness check would miss: a field can contain a value and still be wrong.
Accuracy is one dimension, not a stand-in for overall quality. Completeness checks whether required values and records are present; consistency checks whether records agree across systems. Validity tests whether values follow permitted formats or business rules, while uniqueness checks for duplicates. Timeliness evaluates whether information is current enough for its use. Integrity concerns whether data remains dependable as it moves through processing and between systems. A valid postal code, for instance, can still be inaccurate if it belongs to another customer.
Accuracy Trade-Offs
Accuracy trade-offs arise when teams balance verified values against delivery speed, accessibility, and security. A live sales dashboard may need current transaction data, while slower reconciliation against an authoritative source can catch discrepancies. Broader access may help teams resolve errors, but access controls protect sensitive fields. The right approach depends on the decision’s urgency, the data’s sensitivity, and the cost of acting on an error.
Separate checks by use case instead of imposing one rule across every dataset. A financial report may prioritize reconciliation and integrity, while an operational queue may emphasize timely updates. Finance and healthcare teams rely on accurate data for compliance with regulations such as GDPR and HIPAA, according to the European Union and U.S. Department of Health and Human Services.
For organizations connecting multiple systems, accuracy checks need clear source relationships and field meaning. Teams mapping those requirements across systems can explore a connected-data demonstration as a next step.
Completeness
Completeness measures whether records contain the values and required fields needed for their intended use. A dataset can look populated yet remain incomplete if critical customer, transaction, or consent details are missing.
Missing-Value Rates
A missing-value rate measures empty fields against the records or data elements being assessed. Its inverse helps describe completeness, but the calculation needs a clear denominator: a column, a dataset, or a defined group of records. Track null counts and percentages by field to see where gaps occur, then compare results over time.
Interpret missingness in context. A voluntary customer survey may remain useful when 50% or more of its values are missing, while critical financial data could be considered incomplete when even 2% of total values are missing. A single organization-wide threshold would obscure that difference and could misdirect analytics or remediation.
Completeness of Required Fields
A required-field check measures the share of records containing every field needed for a specific process. For a sales transaction, that might include a customer identifier, transaction date, and amount; an empty amount can prevent accurate reporting. Suggested completeness targets are at least 98% for key fields and at least 95% for descriptive fields.
Define required fields with the process owner, then report missing records separately for each field. This makes results actionable: teams can correct a missing customer identifier at entry instead of treating every incomplete record as the same problem.
Measure completeness at both record and field level. One calculation divides complete data elements by total data elements; another counts records with empty fields as a percentage of all records. These views answer different questions. The first shows overall coverage, while the second identifies records that may fail a process or analysis.
Consent documentation also benefits from field-level tracking when an organization’s process requires it. For example, a consent record could include the customer identifier, recorded choice, and relevant date. A missing value can make the record harder to interpret consistently, so dashboards should distinguish absent documentation from a recorded choice.
Set thresholds according to the data’s purpose and operational impact. A completeness test might flag a record when 10% of its values are missing, while a financial dataset may require a stricter threshold. Align rules with audit, compliance, and operational requirements; then assign ownership for correcting gaps, deleting unusable data, or filling values only when a valid source supports them.
Finally, connect the metric to action. If missing last names rise above the example limit of 2%, alert the responsible team and inspect the field’s source or entry process. Track the same measure after remediation to determine whether the change corrected the underlying issue.
Timeliness
Timeliness measures whether data is available and current enough for its intended use. A correct order record can still mislead a team if it arrives after fulfillment decisions have been made.
Separate three related concepts. Freshness describes how often data is updated. Latency measures the time between data creation and availability. Timeliness asks whether the update schedule meets users’ needs. For example, a live event follow-up queue needs fresher customer activity than a quarterly nurture list.
Measure timeliness by recording source timestamps and comparing them with the current date or expected delivery time. Teams may track data age, delivery time, input time, and volatility, or how long a value remains valid. The percentage of records updated within an agreed service-level timeframe shows whether data meets its intended cadence.
Set freshness targets by use case. Suggested targets are under one hour for real-time data and under 24 hours for batch data. An orders dataset might need to be consumable within two hours of landing, while a separate orders-table check could set a maximum of 24 hours between refreshes. These thresholds answer different operational questions, so define what each check measures.
Timeliness matters when data changes quickly. A current inventory feed can guide availability decisions, while a stale feed can show products that are no longer available. Slower-moving databases may be reviewed weekly or monthly if freshness and compliance thresholds remain in place. The appropriate schedule depends on how quickly the data changes and how decisions use it.
Automated checks can compare actual arrival times with expected schedules, then alert teams when a dataset misses its freshness threshold. Track pipeline duration too: a major increase in processing time can leave downstream reports using stale data. Pair freshness alerts with job-status checks so teams can distinguish a late source from a failed transformation.
Track downtime through time to detection, time to recovery, and total downtime for each dataset. Suggested targets are detection under one hour, recovery under four hours, and less than eight hours of total downtime per dataset per month. These measures show how quickly a failure becomes visible and how long users remain affected.
Review timeliness trends in light of each dataset’s purpose. A recurring delay in a live operational feed calls for a different response than a slow update to a monthly reference table. Compare actual delivery patterns with business deadlines, then adjust schedules or pipeline processing where delays affect decisions.
How data quality metrics support business decisions and AI
Quality measures connect data conditions with the decisions built on them. Their value lies in showing which process or AI use case is affected, not simply producing a score.
KPIs by Industry and Use Case
Data quality KPIs are measures selected to reflect the data risks and decisions in a particular industry or use case. A sales organization might track conflicting customer records that affect account planning, while a finance team may focus on transaction accuracy for reporting. Relevant measures depend on business goals, processes, and the consequences of poor-quality data.
Choose metrics with stakeholders who own the process and use its outputs. For an inventory workflow, a useful KPI might connect the share of product records meeting required standards with stock-planning decisions. For an AI-supported support process, teams could assess whether information presented to the system is current, relevant, and complete enough for its task.
Keep data quality metrics distinct from business KPIs. A quality metric reports a property of data, such as the percentage of records meeting a defined test; a business KPI tracks progress toward a strategic goal. Connect them by identifying how a change in data quality affects an operational result. That connection helps leaders prioritize data issues.
For AI, assess the data used at each stage, from input through retrieval and output review. If an internal assistant presents outdated policy information, trace the issue to the relevant source and update process. Metrics should help teams identify the failure point, assign ownership, and determine whether the resulting answer is fit for its intended workflow.
Financial Impact and ROI
Financial impact measures how data errors affect business activity, while ROI compares the value of improvements with the resources needed to make them. To assess poor data quality, connect a defined issue to observable effects, such as rework, delayed processing, failed transactions, or decisions based on incorrect reports.
Establish a baseline before remediation. For example, record how often a sales process requires manual correction because customer records conflict, then track the same measure after a data change. Include operational effort and downstream effects, and separate costs linked to data quality from unrelated process changes.
AI evaluation calls for the same discipline. Track error patterns in the workflow, the human review required, and whether corrected data changes task outcomes. Present results to business owners and technical stakeholders together. This makes trade-offs visible and directs investment toward quality improvements that support important decisions.
Syntes AI: Enterprise Knowledge Graph
Syntes AI’s Enterprise Knowledge Graph unifies complex data into a structured, actionable format. It is a relevant next step when quality measures reveal disconnected records, unclear relationships, or fragmented context across enterprise systems. A shared knowledge structure can help teams interpret data in relation to the business entities and processes it represents.
For organizations connecting data quality work to AI, Syntes AI’s Cross-System Integrations embed AI capabilities across existing enterprise software stacks. Context Engineering shapes the context AI uses, while the Syntes Agentic Platform enables businesses to deploy and manage AI agents for operational tasks. Together, these offerings help bridge the gap between measuring data and putting connected information to work.
Contact Syntes AI to discuss your data and AI priorities, or visit syntes.ai.
Turn Data Quality Into Operational Practice
Make quality part of how decisions and AI workflows are designed, not a report reviewed after problems surface. Assign clear ownership for critical data, connect each threshold to a responsible process, and define how teams respond when results drift. A disciplined approach to data quality metrics for business makes measurement actionable: teams can prioritize issues by their impact on decisions and improve the underlying process.
When fragmented enterprise information limits this work, Syntes AI’s Enterprise Knowledge Graph, Syntes Agentic Platform, and Cross-System Integrations can help connect structured data with operational AI. Align your data priorities with the systems and workflows that depend on them.
Start with the decisions that matter most. Clear ownership and connected data give teams a stronger foundation for what comes next.
Frequently Asked Questions
What is the difference between validity and accuracy?
Validity checks whether a value follows a defined rule; accuracy checks whether it reflects reality. A date can use the required format and still be wrong for the event. For example, a transaction date may pass a format test but differ from the date recorded in the authoritative transaction system. Use validity tests to catch malformed or out-of-range values, and source comparisons to find inaccurate ones.
What should a starter scorecard look like?
A starter scorecard should connect each measure to a dataset, owner, threshold, and response. Begin with a critical customer, transaction, or product dataset, then track a small set of relevant checks, such as missing required values, duplicate records, or late updates. Show the current result beside its target and trend. Include the affected process and escalation owner so a failed check leads to investigation, not just an isolated dashboard alert.
Where should you prioritize metrics first?
Start with data that influences high-impact decisions or feeds several downstream processes. For example, prioritize transaction data used in financial reporting over a rarely used reference field. Map the reports, workflows, and AI applications that depend on each dataset, then rank issues by their operational consequences and recurrence. Involve the process owner and data steward: they can identify where an error changes an outcome, blocks work, or triggers manual correction.
What are the main data quality dimensions and metrics for businesses?
The main dimensions are accuracy, completeness, consistency, validity, uniqueness, and timeliness. A business can track records matched to a source for accuracy, missing required values for completeness, conflicting cross-system values for consistency, rule-conforming values for validity, duplicate records for uniqueness, and updates delivered within expected timeframes for timeliness. Choose dimensions based on the dataset’s use. A product catalog feeding sales and inventory processes may need different checks from an archival dataset.
How do you calculate data accuracy, completeness, consistency, validity, uniqueness, and timeliness?
Calculate each metric against a defined population: accuracy is records matching an authoritative source divided by records checked; completeness is present required values divided by required values assessed. Consistency is matching values across systems divided by comparisons made; validity is rule-conforming values divided by values tested. Uniqueness is distinct records divided by total records. Timeliness is records updated within the agreed timeframe divided by records expected for that period.
What are good data quality benchmarks or target thresholds for businesses?
Suggested targets include at least 99% accuracy for personally identifiable information and transactional fields, at least 98% completeness for key fields, and at least 95% for descriptive fields. Validity targets are at least 99% for join or filter columns and 95% for freeform fields. Suggested uniqueness targets are 100% for primary keys and 99.5% for natural keys. Treat these as starting points, then align thresholds with data use and business impact.
What are common data quality risks, causes, and remediation strategies?
Common risks include incorrect manual entry, inconsistent definitions across systems, duplicate records, missing values, stale data, and pipeline failures. Schema changes can also disrupt downstream processing. Trace each issue to its source, then correct or standardize data at ingestion, validate required rules, deduplicate records, and reject invalid values before they spread. Assign an owner to each critical dataset and automate tests at import so recurring failures prompt investigation.