
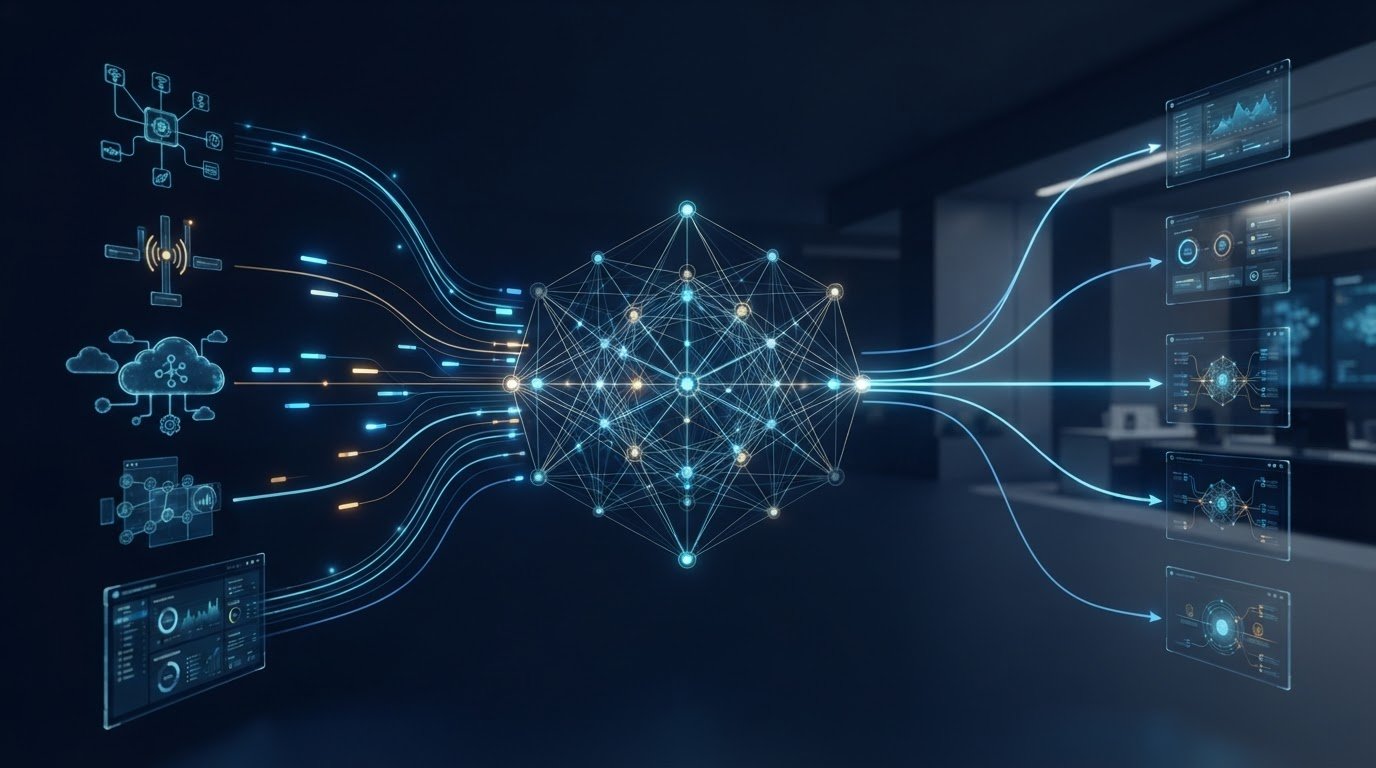
The event that matters is often the one that never arrives. Complex event processing (CEP) analyzes multiple data streams to identify meaningful patterns, correlations, and trends. Complex event processing with knowledge graphs connects those signals to relevant entities and relationships, giving teams a more contextual view of what is happening as events unfold.
Speed alone is not enough. A basic alert may flag a single threshold, while CEP can detect an ordered sequence, a missing event, or several related signals. The challenge is to recognize the pattern, preserve its context, and deliver the result to the right decision or response layer.
This article explains how event producers, processing engines, and consumers work together, and how CEP differs from real-time analytics and rule-based alerts. It also covers how knowledge graphs support pattern recognition and business insight, which conditions help event processing produce useful signals, and when a graph-based context layer can connect isolated events to operational meaning.
Key Takeaways
- Assess whether a signal depends on event order, timing, or correlation before choosing CEP over a simple alert or stream calculation.
- Improve pattern quality by structuring incoming events, linking related context, and accounting for uncertainty and noisy data.
- Understand how monitoring performance, security, and automated decisions helps keep real-time event processing dependable.
- Trace the flow from event producers through the processing engine to consumers to identify where integration or response delays can arise.
- See how connected event context can turn live signals into business insights that support timely decisions.
What is complex event processing?
Complex event processing analyzes multiple data streams to identify meaningful patterns, correlations, or trends while events are still relevant. Complex event processing with knowledge graphs adds connected business context, helping a detected pattern show not only what happened, but also which entities and relationships make it significant.
CEP in Operational Monitoring
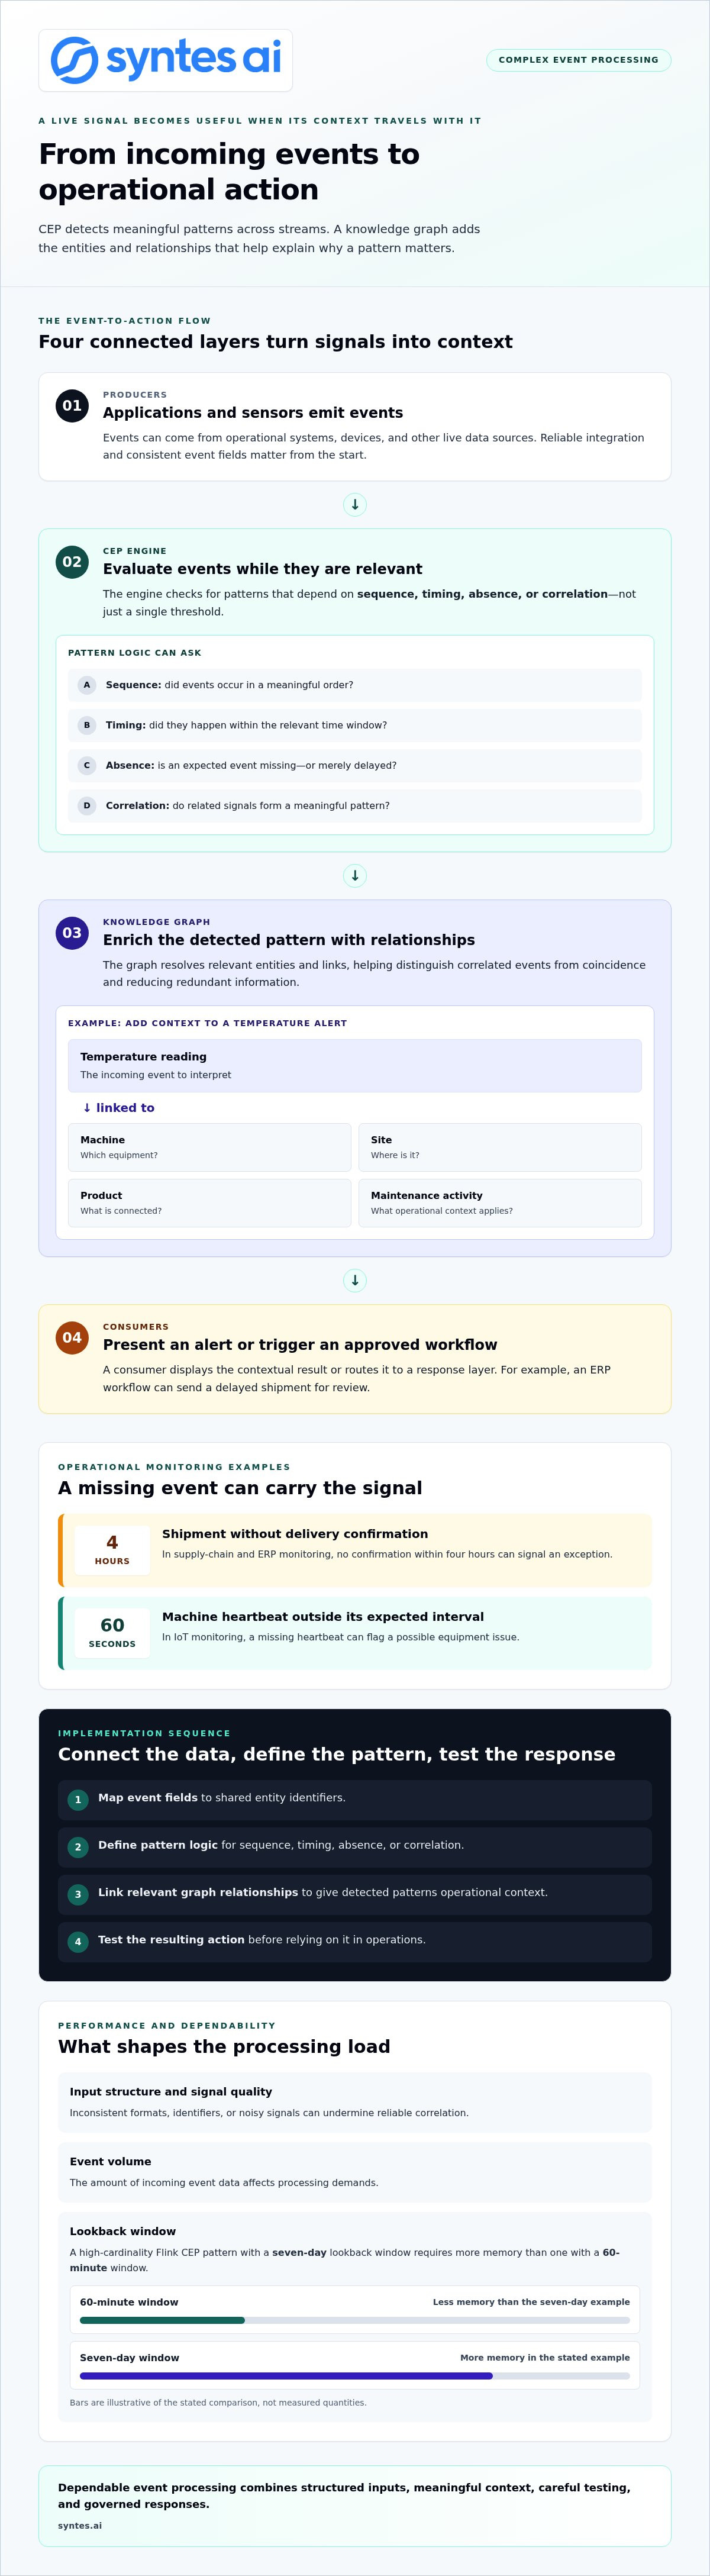
Operational monitoring applies event patterns to live processes, so teams can act on disruptions before they become downstream failures. In supply-chain and ERP process monitoring, a shipment event without a delivery confirmation within four hours can signal an exception; patient monitoring can connect a device reading with the patient and care context, while IoT monitoring can flag a machine heartbeat missing from its expected 60-second interval.
These applications support targeted action and automation. An ERP workflow can route a delayed shipment for review, while an IoT system can raise an alert when sensor events indicate a developing equipment issue. The value depends on reliable integration across event sources and operational infrastructure, not just a fast processing engine.
Knowledge Graphs in Event Processing
A knowledge graph enhances complex event processing by connecting incoming signals to entities, relationships, and relevant operational context. A temperature alert, for example, becomes more useful when linked to the specific machine, site, product, and maintenance activity associated with that reading.
This context helps distinguish correlated events from coincidences and reduces redundant information. The National Institute of Standards and Technology describes a system that removes redundant data and connects correlated activities in a graph database. To handle uncertainty, processing rules can distinguish a missing event from a delayed one, keeping ambiguous signals available for monitoring rather than treating every signal as a confirmed failure.
Representing Events and Relationships
A knowledge graph represents events, entities, and relationships as connected graph elements, allowing an event to be interpreted through its arguments and links. According to the National Institute of Standards and Technology (NIST), nodes represent entities, relations, or events, while labeled edges connect an event or relation to its arguments.
For example, a shipment event can link a package to a route, order, and delivery status. Those relationships let a processing system assess whether a missing confirmation affects a particular order or a wider supply-chain process, rather than treating it as an isolated record.
Combining CEP Engines and Knowledge Graphs
A common architecture ingests events from applications and sensors, processes streams in a CEP engine, and uses a graph database to enrich patterns with connected context. The engine detects sequence, timing, or absence; the graph resolves related entities; and a consumer displays an alert or triggers an approved workflow.
Implementation starts by mapping event fields to shared entity identifiers, then defining pattern logic, linking relevant graph relationships, and testing the resulting action. Performance depends on input structure, signal quality, event volume, and the lookback window; a high-cardinality Flink CEP pattern with a seven-day lookback window requires more memory than one with a 60-minute window. Secure access controls, continuous monitoring, thorough testing, and clear human oversight help govern sensitive events and automated decisions.
CEP compared with real-time analytics and rule-based alerts
Real-time analytics summarizes incoming data to show current conditions, while complex event processing detects patterns across events and can trigger a response. A dashboard might show rising transaction volume; CEP can assess whether transaction order, timing, and linked activity form a defined scenario. The distinction is the task: analytics explains what the stream shows, while CEP tests whether events together meet meaningful pattern logic.
Consider a retail operations dashboard that counts mouse clicks within a fifteen-minute window. This stream-processing calculation answers a bounded question: how many clicks arrived during the window? CEP is relevant when the system must evaluate relationships across event types, such as a customer action followed by an inventory change and an order status update. The required logic, not the platform label, determines the approach.
Rule-based alerts are narrower still. A rule can notify an operator when one sensor reading crosses a threshold, or when more than five failed logins occur within a 10-minute window. When event ordering is not important, that failed-login example can be handled as a windowed count rather than a CEP pattern. CEP is better suited to cases where sequence, timing, absence, or correlation changes the meaning of the alert.
These approaches can work together. Analytics can reveal a developing trend, a simple alert can flag a clear threshold breach, and CEP can evaluate a multi-event sequence before an operational action begins. For example, a logistics team might use analytics to inspect late deliveries, a rule to flag a missed dispatch cutoff, and CEP to connect a delayed handoff with a missing confirmation and an affected order.
Compatibility becomes critical when applications publish inconsistent event formats or identifiers. Timestamps recorded in different time zones, an order ID represented differently in an ERP and shipping system, or a sensor event without a stable asset identifier can undermine reliable correlation. Map fields to shared meanings, normalize timestamps, and define how to handle late or duplicate events before relying on patterns across streams.
Choose by outcome. Use analytics for exploration and reporting, direct alerts for independent conditions, and CEP for ordered or correlated events. In a 15-minute click-counting task, stream processing may be sufficient; a process involving a sequence across a payment application and an order system may need CEP. Teams assessing those boundaries can discuss event-processing architecture in the context of their systems and operational decisions.
CEP definition and real-time pattern recognition
Complex event processing evaluates incoming events against patterns and identifies matches as streams arrive. With graph context, engines can connect those matches to related entities, helping an organization interpret events rather than merely count them.
Real-Time Pattern Recognition
Real-time pattern recognition tests event sequences, timing, and conditions against defined logic. A temperature rule, for example, can identify three consecutive readings above 28 degrees within a 10-second window. The engine evaluates each new event against the active pattern, making the result useful while an operational response can still matter.
Pattern definitions vary by task. One study defines nine event pattern rules for activity recognition and traffic management, illustrating how a platform can express distinct operational conditions. Flink CEP supports event-pattern processing; its Pattern API and DataStream API provide ways to define patterns and process streams. The architecture should match the event structure and the response required.
Event-Rule Operators and Authoring
Event-rule operators express how events relate, including sequence, absence, repetition, and time constraints. For example, a rule can look for a machine fault followed by a shutdown, or detect a missing heartbeat expected every 60 seconds. Operators make the conditions explicit, so teams can inspect why a pattern matched and refine its logic.
Visual authoring can represent a pattern as connected steps, while code-based authoring supports precise control. AI-assisted tools can help translate a plain-language condition into a draft rule, but the organization still needs to validate its event fields, timing, and edge cases. For Flink CEP, a SQL approach is based on the ISO standard from December 2016.
Rule-Based and AI-Driven Patterns
Rule-based patterns are explicit: a fraud rule might identify more than three transactions over 500 euros within 10 minutes across different merchants. The conditions are visible and testable, which helps teams audit the resulting decision. A rule is effective when the organization can state the relevant event sequence and thresholds clearly.
AI-driven pattern detection can surface correlations that were not predefined, while rules enforce known business conditions. Each approach serves a different need. A platform can use a model to identify unusual activity, then apply a rule to determine whether that signal meets an action threshold. Human review and monitoring help assess whether model-driven patterns remain relevant as event behavior changes.
Temporal Reasoning and Event Correlation
Temporal reasoning evaluates when events occurred and how their order relates to a pattern. A machine heartbeat expected every 60 seconds can be treated as a missing-event pattern when the next expected signal does not arrive. Correlation adds identity and context, linking a sensor reading to its asset, location, and associated process.
Knowledge graphs represent these links, allowing a CEP engine to evaluate related events across connected entities. Query languages and standards depend on the architecture: Flink CEP offers Pattern and DataStream APIs, while SQL can express event-processing logic. Together, temporal conditions and graph relationships help distinguish a meaningful sequence from unrelated events.
CEP benefits and real-time business insights
Complex event processing turns continuous event streams into timely operational signals. Its business value comes from detection: identifying a defined pattern early enough for the relevant team or system to respond. A batch report may surface a process deviation 24 hours after it occurs, while a live processing architecture can expose the underlying sequence as events arrive. That changes when a decision becomes possible, not simply how a report looks.
Latency matters when an event’s meaning decays quickly. Some financial and logistics insights need a response in milliseconds rather than hours or days. A finance team can use a detected transaction pattern to prioritize review while activity is current; a logistics operation can use linked status events to identify a developing delay. CEP supplies the detection layer, while business rules determine which signal warrants action.
Context improves the quality of these insights. A processing engine can match a pattern, but a connected knowledge graph can relate it to the affected account, order, asset, or process. For example, an order delay linked to a supplier and production schedule provides more actionable context than a standalone status alert. This architecture helps decision-makers assess operational impact and route the signal to the appropriate application.
Benefits depend on the whole system, not one component. Event producers must deliver well-structured inputs, the engine must evaluate patterns within relevant time windows, and consumers must receive results in a usable form. If identifiers differ between an ERP record and a logistics event, correlation can fail. Mapping shared entities and monitoring data quality are practical steps toward dependable insights.
Continuous monitoring also supports responsible automation. Teams can track whether events arrive as expected, whether patterns produce useful detections, and whether downstream actions follow the defined process. Automated decisions require thorough testing, continuous monitoring, and clear human oversight. For a financial alert, this means examining both the pattern match and the resulting review workflow, rather than treating every generated signal as a final decision.
CEP supports a shift from retrospective explanation to timely operational intelligence. A dashboard can show a deviation after a reporting cycle; a live pattern can identify it while its source events remain actionable. The strongest business insight emerges when low latency, relevant context, and a clearly defined response path work together. Leaders can then connect each detected pattern to its operational consequence and the decision it should inform.
Event producers, processing engines, and consumers
A complex event processing system has three parts: event producers, a processing engine, and event consumers. Producers publish events, the engine evaluates them, and consumers use the resulting output. This architecture sits downstream of event ingestion and streaming infrastructure, and upstream of automated response and decision-making. Each handoff matters: a pattern can inform action only if its source event reaches the engine and its result reaches the right consumer.
Producers include ERP applications, payment systems, IoT sensors, and logistics platforms. Each may describe the same business object differently. For example, an order system might publish an order number while a warehouse event uses a shipment identifier. Mapping these fields to shared entities lets the engine relate events across the wider ecosystem instead of treating each message as isolated data.
The processing engine consumes the event stream and applies defined logic. It can evaluate sequence, timing, counts, and missing events, then emit a matched event pattern. Graph context can enrich that match with connected entities, such as the supplier, order, and production line associated with a delay. Keep pattern logic separate from entity mapping so teams can update a rule without breaking shared context.
For high-volume, low-latency processing, dedicated streaming infrastructure provides scalability, fault tolerance, and event-ordering guarantees. Ordering is critical when a model or rule expects a sequence, such as authorization before settlement. The engine must also account for duplicate messages and late arrivals, because either can distort a pattern’s result or trigger repeated output.
Consumers turn engine output into an operational result. A monitoring dashboard can display a matched pattern, a workflow can route it for review, and an automated decision layer can initiate a defined response. Assign each consumer a clear responsibility. For example, a fraud pattern may create an investigation task, while a human oversees the final account action.
Monitoring should cover the full path, not just engine speed. Track whether producers deliver valid events, whether the engine processes them in order, and whether consumers receive and act on results. If an ERP event arrives without a usable order identifier, the pattern may never match. If a consumer fails to acknowledge an output, the operational response can stall despite successful detection.
The practical takeaway is to design the producer, engine, and consumer contracts together. Specify event identity, ordering needs, graph relationships, pattern ownership, and the expected consumer response. That gives the organization the ability to trace a result from its originating application to its final action. Map your event-processing architecture
Syntes AI: Enterprise Knowledge Graph
Syntes AI’s Enterprise Knowledge Graph unifies complex organizational data into a structured, actionable format. It is relevant when event producers span ERP, logistics, and IoT applications but lack shared context for reliable pattern detection. Cross-System Integrations connect information across existing software environments, while Context Engineering structures the context AI systems use.
For organizations extending event-driven operations into AI workflows, the Syntes Agentic Platform enables businesses to deploy and manage AI agents for operational tasks. Together, these offerings connect event signals with business context and support the transition from detection to informed action. A useful next step is to map where event data, relationships, and operational decisions need to connect.
Contact Syntes AI or visit syntes.ai to explore the approach.
Turn Event Signals Into Operational Readiness
The next challenge is organizational: decide which event patterns should inform action, who owns those decisions, and how their effects will be assessed. Treat complex event processing with knowledge graphs as an operating capability, not an isolated technical deployment. Start with a meaningful business decision, then align event definitions, context, governance, and oversight around it.
That focus keeps implementation grounded. Teams can prioritize operational decisions where connected context will change what people or systems do, then refine the architecture as needs evolve. Syntes AI’s Enterprise Knowledge Graph, Syntes Agentic Platform, and Cross-System Integrations support organizations shaping this approach.
Build around decisions that matter, and give every event signal a clear operational purpose.
Frequently Asked Questions
How does knowledge graph-based complex event processing compare with stream processing and traditional CEP?
Knowledge graph-based complex event processing adds entity relationships to event evaluation, while stream processing commonly transforms or aggregates incoming data. Traditional CEP detects conditions across event sequences; graph context can help interpret how a match relates to connected business objects. For example, a service disruption can be assessed alongside its linked supplier, inventory position, and affected commitments. Use graph enrichment when those relationships change the decision, not simply to add complexity.
What are common use cases for complex event processing with knowledge graphs?
Common uses include connecting supply-chain disruptions to inventory commitments, correlating financial activity across accounts, and linking IoT anomalies to asset context. In ERP process monitoring, an organization could relate a delayed approval to the purchasing workflow and affected order. For patient monitoring, connected context can help interpret a device signal alongside relevant care events. The most useful patterns are those where a signal’s meaning depends on its relationship to other records.
What are the scalability, latency, and throughput trade-offs of these systems?
Scalability depends on event volume, pattern complexity, retained state, and graph lookups. Enriching every incoming event with broad graph queries can increase processing demands and affect latency; selective lookups preserve context for decisions that need it. Throughput also depends on infrastructure capacity and event-ordering needs. Teams can separate high-volume filtering from deeper context enrichment, then monitor queue growth, processing delays, and consumer lag under representative loads.
What are the main implementation challenges, security risks, and data governance concerns?
Common challenges include inconsistent identifiers, unclear event ownership, stale relationships, and patterns that trigger duplicate actions. Security risks arise when event payloads or graph queries expose information beyond a user’s or workflow’s role. Define data ownership, access permissions, retention rules, and audit trails before enabling automated responses. Test malformed and replayed events, document pattern changes, and retain human review for consequential decisions so governance covers both data and resulting actions.