

A data asset’s value goes beyond its storage cost, and no single measure captures it. To understand how to measure the value of data, assess its functional, experiential, symbolic, and economic value, then connect those dimensions to costs and business outcomes. The right approach depends on what the organization needs the data to achieve.
It is easy to count what data costs to collect, store, and maintain. The harder question is whether it improves decisions, operations, customer experiences, or strategic opportunities enough to justify that investment. A credible assessment makes those connections visible.
This article explains how to evaluate data’s value drivers, compare costs with measurable impact, and choose methods suited to the decision at hand. Quality, usage, and business performance all shape the picture. Ultimately, a data asset’s value depends on how effectively it informs action.
Key Takeaways
- Assess data across functional, experiential, symbolic, and economic dimensions to capture value beyond its direct financial return.
- Connect data to business outcomes, then weigh those outcomes against the costs of capturing, maintaining, and using the asset.
- Use market demand and external willingness to pay as signals of a data asset’s potential value beyond internal operations.
- Combine qualitative customer research with measures of importance and performance to uncover and prioritize value drivers.
- Measure intrinsic value through data quality, including validity, rather than relying on volume alone.
Functional, experiential, symbolic, and economic value
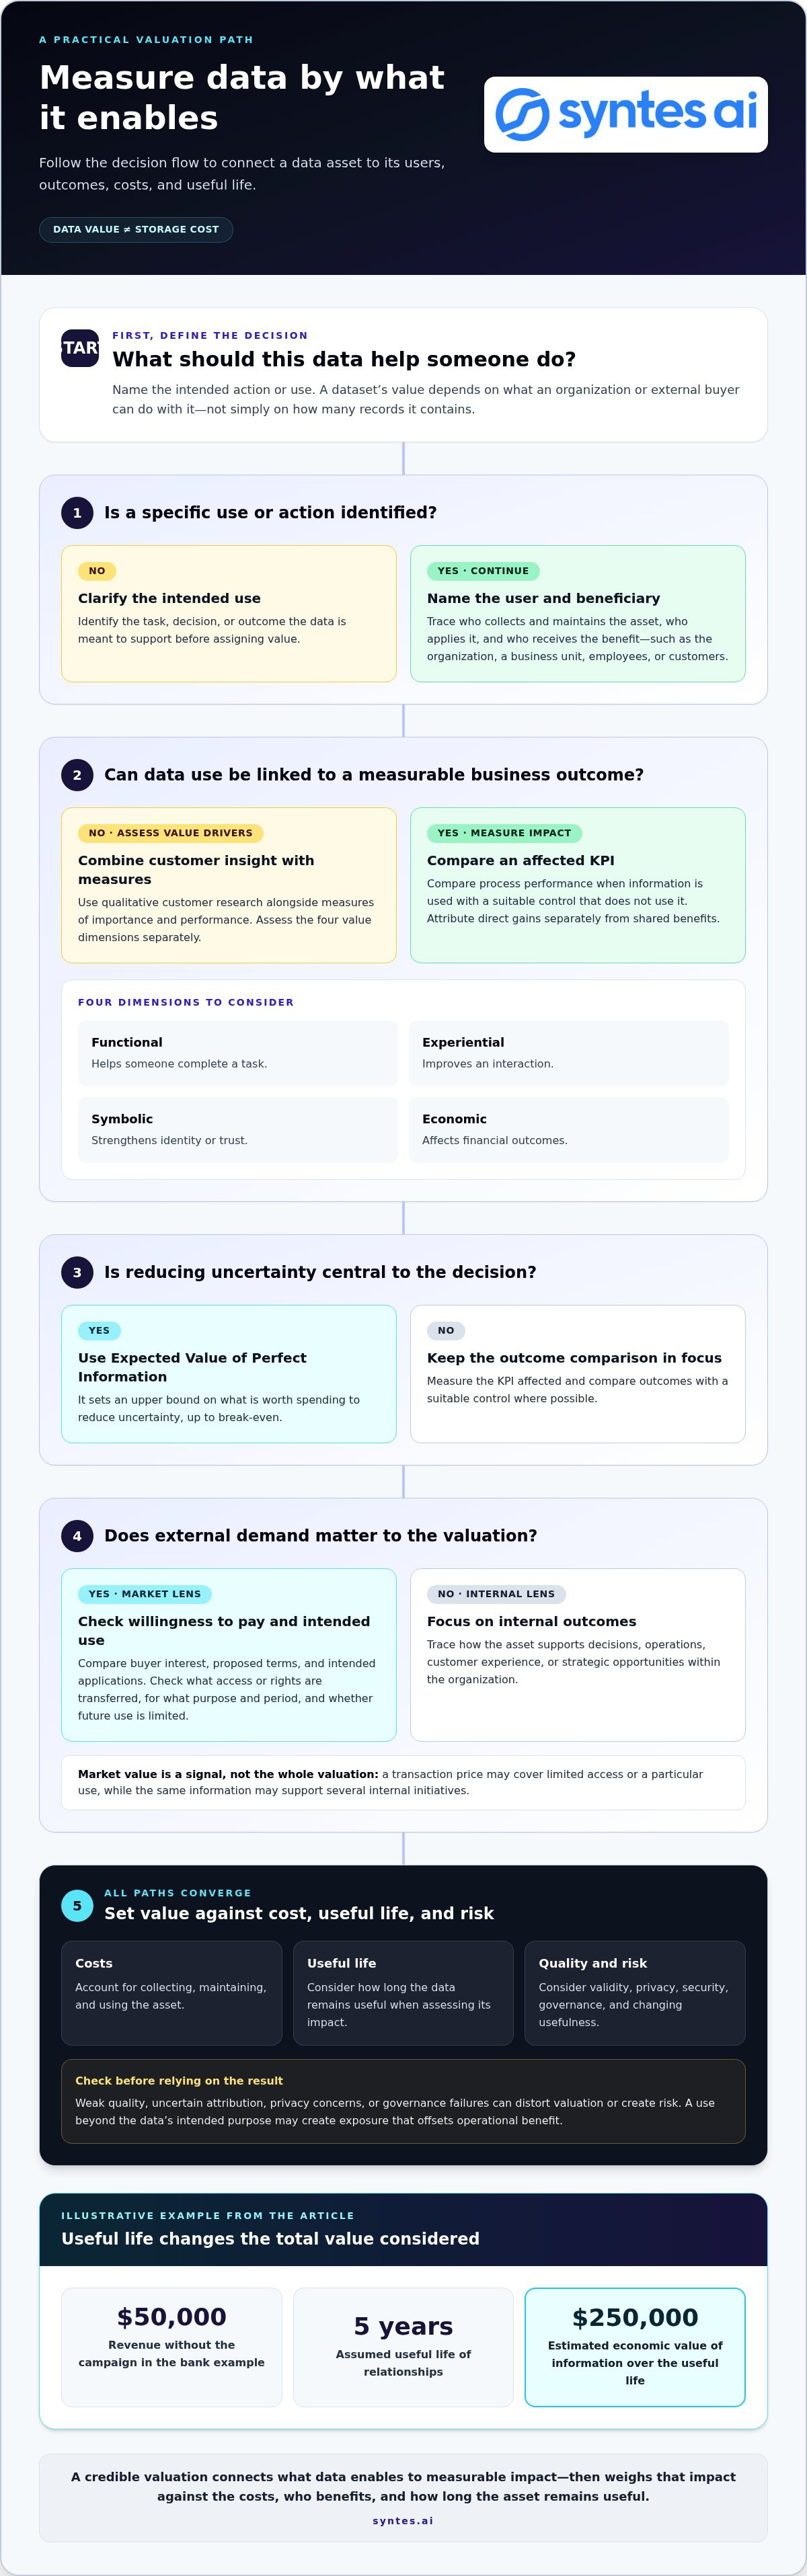
To understand how to measure the value of data, separate what it enables from what it costs. Assess four dimensions: functional value, which helps someone complete a task; experiential value, which improves an interaction; symbolic value, which strengthens identity or trust; and economic value, which affects financial outcomes. For example, a reliable product recommendation can help a customer choose, make the purchase experience easier, reinforce confidence in a brand, and influence revenue.
Common methods compare business performance with and without information, estimate the value of reducing uncertainty, assess data-related costs, and examine market demand. The Performance Value of Information model compares a process KPI when information is used with the KPI for a control group that does not use it. Expected Value of Perfect Information sets an upper bound on what is worth spending to reduce uncertainty, up to break-even.
Economic contribution becomes useful when teams connect data to an action and a measurable result. Measure the KPI affected, compare outcomes with a suitable control, and account for how long the data remains useful. A 10 percent improvement in a KPI can illustrate performance value, but its economic effect depends on the process: fewer errors, faster decisions, or more completed sales can produce different bottom-line results.
Value also needs to be attributed across economic actors. A data asset may benefit the organization that collects it, a business unit that applies it, employees who use it, and customers who receive better service. To determine attribution, trace each benefit to its source, identify who bears collection and maintenance costs, and separate direct gains from shared ones. For instance, a customer insight may inform marketing action and improve service-team interactions.
A bank campaign example shows why useful life matters. The example also estimates $50,000 in revenue without the campaign and assumes relationships remain useful for 5 years. Its economic value of information is $250,000 over the useful life of the data.
In the United States, Gartner’s information-valuation framework includes intrinsic, business, performance, cost, market, and economic measures. Doug Laney’s Infonomics, Chapter 11, describes valuation methods; these frameworks organize analysis rather than establish one universal data price or accounting standard. Market value can also be assessed by asking whether external parties would pay for access to or use of an asset.
Data valuation has limits. Weak quality, uncertain attribution, changing usefulness, privacy concerns, and governance failures can distort results or create risk. For example, using a dataset beyond its intended purpose may create exposure that offsets its operational benefit. Before acting on a valuation, consider privacy compliance, security incidents, and adherence to governance standards alongside financial metrics.
Customer value offers another lens: people perceive value when they feel they receive more than they give up. Measure functional, experiential, symbolic, and economic drivers separately, then determine which matter to the decision. A data asset earns strategic leverage when its quality and use enable better choices, differentiated service, or new business opportunities, not simply because it contains many records.
What is the value of data?
Data value depends on what an organization or external buyer can do with it. Market demand offers another lens: whether others will pay for access or use, and what that willingness reveals about the asset’s usefulness.
Demand and Willingness to Pay
Market value is indicated by external parties’ willingness to pay for access to or use of a data asset. That signal matters because internal teams can overstate value when they focus only on collection effort or potential uses. Compare actual buyer interest, proposed terms, and intended applications. For example, a retailer’s transaction data may interest a supplier seeking demand insights, but the use case determines its relevance.
Selling or trading data can reveal market value, but a transaction price does not automatically represent the asset’s full economic value. A license may cover limited access, a particular purpose, or a defined period, while the same information could support several internal initiatives. Assess what the buyer receives, what rights are transferred, and whether the exchange limits future use. These distinctions help stakeholders prioritize opportunities without treating every expression of interest as revenue.
Demand also depends on whether data is usable in the buyer’s context. A dataset with clear definitions and consistent fields may support a specific analysis; records without context may require additional work before they produce actionable outcomes. Compare buyer needs with the asset’s coverage, freshness, and permitted uses. This helps determine whether a market signal reflects durable utility or a narrow, one-time requirement.
Information Value and Market Structure
Information may be valuable to an organization when it can support decisions or be exchanged. Market structure matters because access and bargaining power shape who captures that value. If one organization controls a dataset others need, it may have greater negotiating leverage. If buyers have alternatives, they can compare substitutes and seek different terms.
Unequal access can also affect which organizations benefit from data-driven decisions. A large platform with extensive data may identify patterns unavailable to smaller participants, while restricted access can limit competitors’ ability to improve products or services. To assess market value, map who contributes data, who controls access, and who receives the resulting benefits. This makes distribution visible alongside overall commercial outcomes.
Use a practical assessment: identify potential buyers and users, define the access or use being considered, then compare their stated needs with the asset’s actual capabilities. Separate direct revenue from strategic value, such as improved market positioning or a new business opportunity. A data asset can be valuable without a sale if it informs a decision that creates advantage; conversely, buyer interest alone doesn’t establish lasting value. Teams examining how data connects across systems can explore data-value measurement as part of that assessment.
Valuing data products by assessing cost and impact
Assess a data product by linking its costs to the decisions and outcomes it enables. A practical way to understand how to measure the value of data is to compare its contribution with the effort required to capture, maintain, and apply it.
Assessing Costs and Impact
Cost-and-impact assessment connects data-product expenses to operational or financial outcomes. The Cost Value of Information model attributes a share of data-capture process costs to the data, adjusted for its usable life and the measurement period. This helps distinguish assets that improve processes from those that add maintenance work without improving decisions.
For example, trace a warranty-claim delay to inconsistent product records, then measure processing time and rework before and after correcting them. Include data preparation and upkeep in the comparison. This makes the contribution visible in the process itself, rather than treating a technical improvement as proof of business impact.
Prioritizing Improvements and Data Choices
Prioritization ranks data improvements by expected impact, feasibility, and cost. Compare datasets by their connection to decisions, quality, maintenance needs, and contribution to business outcomes. This gives teams a basis for deciding which data to collect, improve, or retain, rather than assuming broader coverage always creates greater value.
Suppose teams can standardize supplier records or collect additional fields. Compare the expected effect of each option on purchasing decisions with the effort required. Prioritize the improvement with a clearer path to measurable outcomes and manageable implementation. Teams evaluating how to measure the value of data can use this comparison to focus investment on information that supports action.
Revenue, Savings, and Data Loss
Revenue and savings measures show the financial outcomes generated when data informs decisions. Link a data product to sales, reduced rework, lower operating expense, customer satisfaction, or improved efficiency. A customer survey can indicate whether a service change matters to users, while process measures show whether it also reduces repeat work.
Data loss creates costs when missing or incorrect information disrupts a process. Trace an outage or failure to its data cause, then assess lost output, recovery work, and operational interruption. This captures the downside of unreliable access alongside the gains from data-supported initiatives.
Valuing Information Without a Market Price
Without a direct market price, estimate information value through its effects on decisions and outcomes. The Cost Value of Information model assigns a share of capture-process costs to data and adjusts for usable life and the measurement period. Compare that cost with attributable revenue, savings, or return on investment.
Consider data that improves maintenance scheduling. If teams use it to plan work more effectively, assess the resulting process outcomes and the ongoing cost of keeping the information useful. Its value depends on whether it changes decisions and how long those improvements last, not simply on the volume collected.
Update frequency also affects cost and usefulness. If a data product is queried only on Fridays, a weekly update, such as Thursday afternoon, may preserve reliability while lowering compute costs. Match refresh schedules to actual demand, then monitor usage and outcomes to determine whether the product continues to serve its purpose.
Six Sigma can help quantify the value of business processes and improvements enabled by data. Apply it to a defined process, connect the change to performance measures, and record data-capture and upkeep costs. Consistent measures let stakeholders compare data products and decide which assets warrant continued investment.
Qualitative research to identify value drivers
Qualitative research reveals which data-enabled outcomes matter to customers and employees. Data quality also shapes value: accuracy supports sound decisions, completeness reduces gaps, timeliness keeps information relevant, and uniqueness prevents duplicates from distorting analysis.
Researching Data Value Drivers
Qualitative research identifies the needs and outcomes that make a data-enabled product valuable to its users. Interviews, observation, and open-ended survey questions can expose friction that existing metrics miss. For example, customers may value faster resolution more than an additional feature, changing which data an organization should prioritize.
Turn those findings into testable drivers. Group recurring needs, then assess their importance and current performance. Potential gain analysis can reveal where a value gap exists. Conjoint and statistical analysis can then validate and rank the drivers, helping decision-makers direct investment toward outcomes customers actually value.
Keep the research focused on a real choice. Ask customers what influences their selection, what makes an interaction difficult, and what would improve the result. For a delivery service, interviews might reveal that accurate arrival estimates matter more than extra status messages. That finding gives teams a specific hypothesis to test against customer-experience measures.
Data Quality and Value
Data quality determines whether information can support dependable decisions and useful outcomes. Accuracy measures whether records reflect correct values; completeness checks whether essential fields are present. Timeliness asks whether data arrives while action is still possible, and uniqueness helps identify repeated records that could inflate counts.
Consider a customer list with duplicate profiles and outdated contact details. A campaign could overcount its audience, miss reachable customers, and misread performance. Assess accuracy, completeness, consistency, and timeliness against the intended use. Data quality metrics can also include validity and integrity, revealing whether records meet defined rules and remain trustworthy across processes.
Quality requirements should follow the decision, not an abstract ideal. A report used for long-term planning may tolerate slower updates than a live operational process. A data product queried only on Fridays, for example, can be updated weekly, such as on Thursday afternoons, without affecting its reliability. This keeps quality assessment grounded in practical use.
A data-driven organization makes evidence part of decisions, not a separate reporting exercise. Teams define the decision, identify the required data, assess its quality, and review the outcome. This discipline matters in AI adoption because a model or agent can use only the context it receives. Relevant, accurate information supports useful outputs; missing context weakens them.
The U.S. Census Bureau’s Management and Organizational Practices Survey includes 50,000 manufacturers, illustrating the scale at which organizational practices can be examined. For an individual organization, the same principle applies at operational scale: combine employee insight, customer feedback, and process evidence. Review what worked and what missed the intended outcome, then adjust data initiatives and measures accordingly.
Intrinsic value of information
Intrinsic value assesses information quality before assigning value to a particular business use. It focuses on whether the data itself is valid, rather than on revenue or a market transaction. This distinction matters: a large collection can look substantial while containing errors that weaken analysis and decision-making.
Validity provides a measurable starting point. Validity is a way to assess whether records contain correct values. To calculate it, define what counts as correct, assess a representative set of records against that definition, then divide the number of correct records by the number assessed. A customer record, for example, might be valid only when its required fields match the authoritative source.
That result is meaningful only when the rule fits the data’s intended role. An address might be valid for billing when it meets billing requirements, yet unsuitable for location analysis if geographic fields are missing. Document the test, the comparison source, and the fields included. Otherwise, teams may report different validity results for the same asset.
Volume alone doesn’t establish intrinsic value. A hypothetical 65-terabyte collection illustrates why size cannot be entered on an accounting ledger as an asset value by itself. The volume says how much data exists, not whether its records are correct, usable, or governed well enough to support analysis. A smaller, valid dataset may be more dependable for a defined task.
Use quality metrics to show where intrinsic weaknesses affect use. Alongside validity, assess accuracy, completeness, consistency, and timeliness. For example, a correctly formatted but outdated inventory record may pass a format check while failing to support a current decision. Measure each dimension separately so teams can identify whether errors, missing fields, conflicting definitions, or stale records are causing the problem.
Governance gives those measures operational meaning. Assign ownership for definitions, validation rules, and remediation, then record how results change over time. Privacy compliance, security incidents, and adherence to governance standards also belong in the assessment. A dataset with high validity still carries risk if access or use is poorly controlled, so evaluate quality and governance together.
Intrinsic assessment does not replace measuring business contribution. It establishes whether information is fit for consideration, then helps explain why a downstream result succeeded or failed. If a forecast misses, for instance, teams can examine record validity and timeliness before attributing the outcome to the model or process. This separates data defects from other causes.
Make the assessment repeatable: define the dataset and intended use, set validation criteria, calculate validity, record quality issues, and assign remediation. Then compare results across data assets using consistent definitions. This provides a clearer basis for prioritizing governance and quality work, while keeping intrinsic quality distinct from economic or market value.
Syntes AI: Enterprise Knowledge Graph
Syntes AI’s Enterprise Knowledge Graph unifies complex data in a structured, actionable format. It is relevant when information is fragmented across systems and teams need connected context to assess data’s contribution to decisions, workflows, or AI initiatives.
Cross-System Integrations connect data across systems, while Context Engineering structures relevant information for use. Together, these capabilities can clarify relationships between data assets, supporting more consistent analysis of where value is created and where gaps remain.
For organizations applying AI to operational tasks, the Syntes Agentic Platform enables businesses to deploy and manage AI agents. It is a practical next step when valuation identifies data worth connecting to workflows and action.
To discuss how these capabilities fit your data environment, contact Syntes AI or visit syntes.ai.
Turn data valuation into operational momentum
Data valuation is most powerful when it shapes what the organization does next. Make assessment part of investment decisions: identify which information should support action, who owns its quality, and how outcomes will inform future priorities. That turns measurement into an operating discipline, not a report that ends on a dashboard.
For organizations ready to connect valuation with execution, Syntes AI offers an Enterprise Knowledge Graph to structure complex data, Cross-System Integrations to connect existing software environments, and the Syntes Agentic Platform to deploy and manage AI agents for operational tasks. These capabilities are relevant when fragmented information makes it difficult to translate assessed data value into coordinated action.
The next step is to define a business decision where connected, actionable information could make a difference. Use that decision to focus the conversation and establish what value should look like in practice.
With a clear decision in view, your organization can move from assessing data to putting its potential to work.
Frequently Asked Questions
What does data value mean, and how is it different from data quality or cost?
Data value is the benefit an organization can realize from using information. Data quality describes whether that information is fit for a particular use, while cost captures the resources needed to create, maintain, and use it. A customer-support dataset might be accurate but rarely used, limiting its realized value. A smaller dataset can be valuable if it helps resolve a recurring decision bottleneck.
How can you calculate the financial value or ROI of a dataset?
Estimate the financial benefit attributable to the dataset, subtract its relevant costs, then divide the net benefit by those costs to calculate ROI. Include costs such as collection, preparation, storage, and ongoing maintenance. To avoid crediting the dataset for unrelated changes, compare results with a reasonable baseline or control. For example, isolate the effect of a new customer-segment analysis from a simultaneous pricing change.
How do companies estimate data’s contribution to revenue, cost savings, and risk reduction?
Companies connect data use to a specific financial outcome and establish how much it plausibly influenced. For revenue, compare sales from decisions informed by the data with a suitable baseline. For savings, track avoided labor or rework. For risk reduction, examine changes in incidents and their business impact. A fraud team, for example, can assess whether data-informed alerts help prevent losses without treating every flagged transaction as prevented fraud.
How can organizations measure the value of data products and analytics projects?
Start with the decision the product is meant to improve, then evaluate adoption and downstream results together. A dashboard that receives frequent visits may still have little value if users make the same decisions without it. Track whether intended teams use its outputs, whether those outputs change actions, and whether the target outcome improves. For an analytics project, document the decision before launch to give later evaluation a clear reference point.
What steps and metrics can an organization use to build a data valuation process?
Define the asset and intended use, assign an accountable owner, select outcome and quality measures, and record relevant costs. Track measures such as usage, decision adoption, data validity, availability, and business outcomes. Keep definitions consistent across assets so teams can compare them fairly. Review accomplishments and misses approximately every six months, then adjust measures or investment priorities based on the evidence.